Fig. C.5
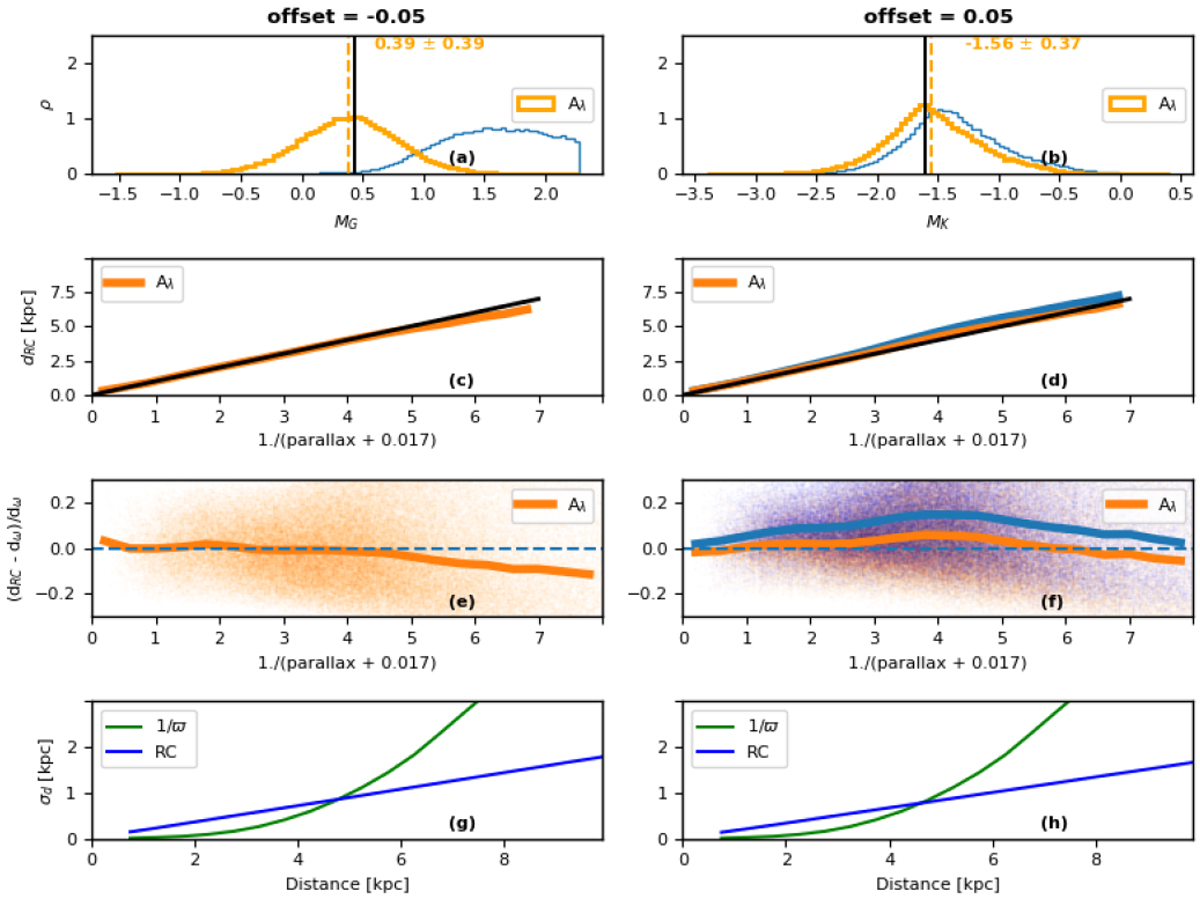
Red clump sample inspection. (a and b) Absolute magnitudes in G and K for the selected sample. The yellow curves use the 3D extinctions from Bayestar, while the blue curves are for zero extinction shown just for illustration of shift towards the correct literature value upon reddening correction. Panels c–f compare theRC distances to inverse parallax, while panels g and h show the error in distances as a function of d for the two methods. Beyond 5 kpc, RC distances become more reliable than inverse parallax.
Current usage metrics show cumulative count of Article Views (full-text article views including HTML views, PDF and ePub downloads, according to the available data) and Abstracts Views on Vision4Press platform.
Data correspond to usage on the plateform after 2015. The current usage metrics is available 48-96 hours after online publication and is updated daily on week days.
Initial download of the metrics may take a while.