Free Access
Fig. C.1
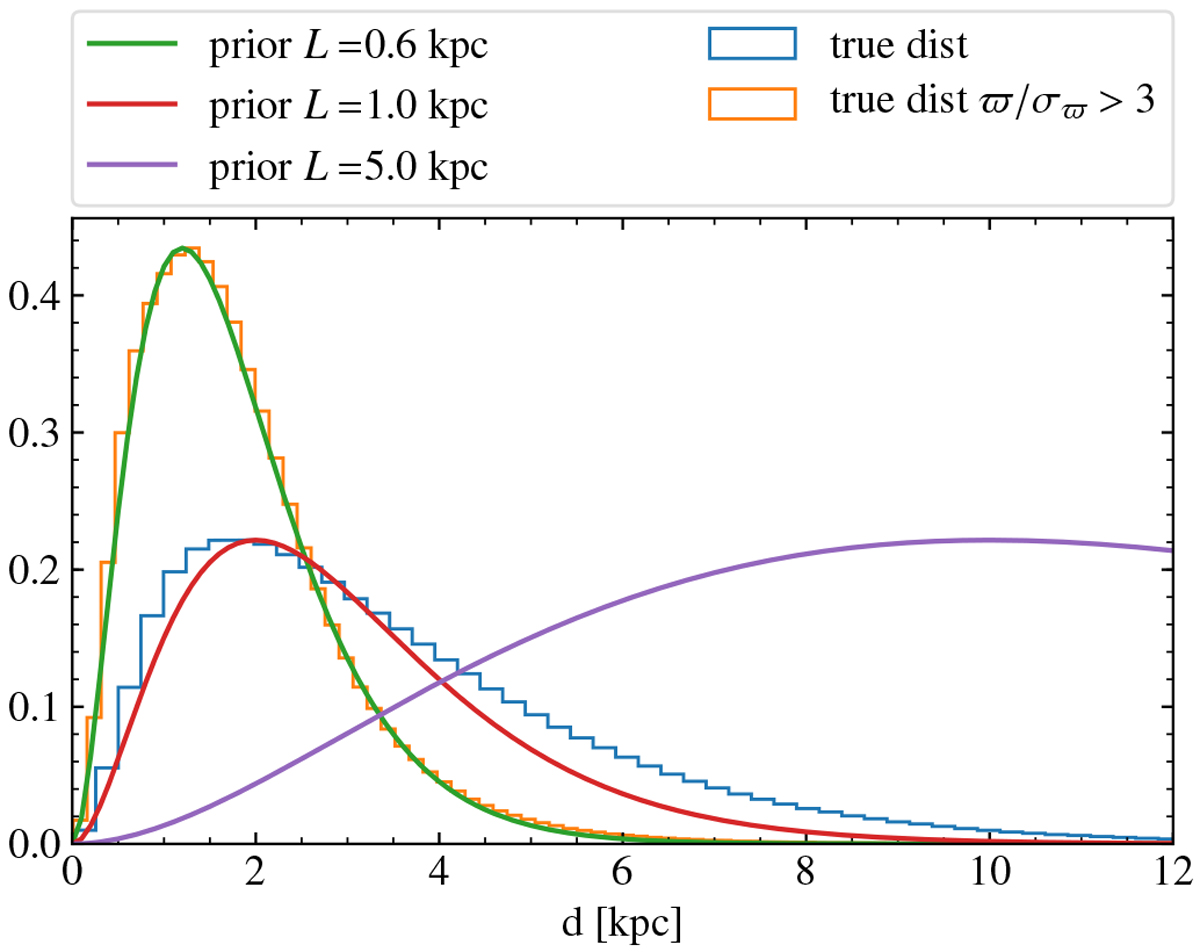
Distribution of true distances of GOG in the anticentre. We show all stars in GOG (blue histogram) and stars with ϖ∕σϖ > 3 (orange histogram). The different solid lines are the exponential decreasing prior (Eq. (C.1)) with scalelength of 0.6, 1 and 5 kpc.
Current usage metrics show cumulative count of Article Views (full-text article views including HTML views, PDF and ePub downloads, according to the available data) and Abstracts Views on Vision4Press platform.
Data correspond to usage on the plateform after 2015. The current usage metrics is available 48-96 hours after online publication and is updated daily on week days.
Initial download of the metrics may take a while.