Fig. B.3
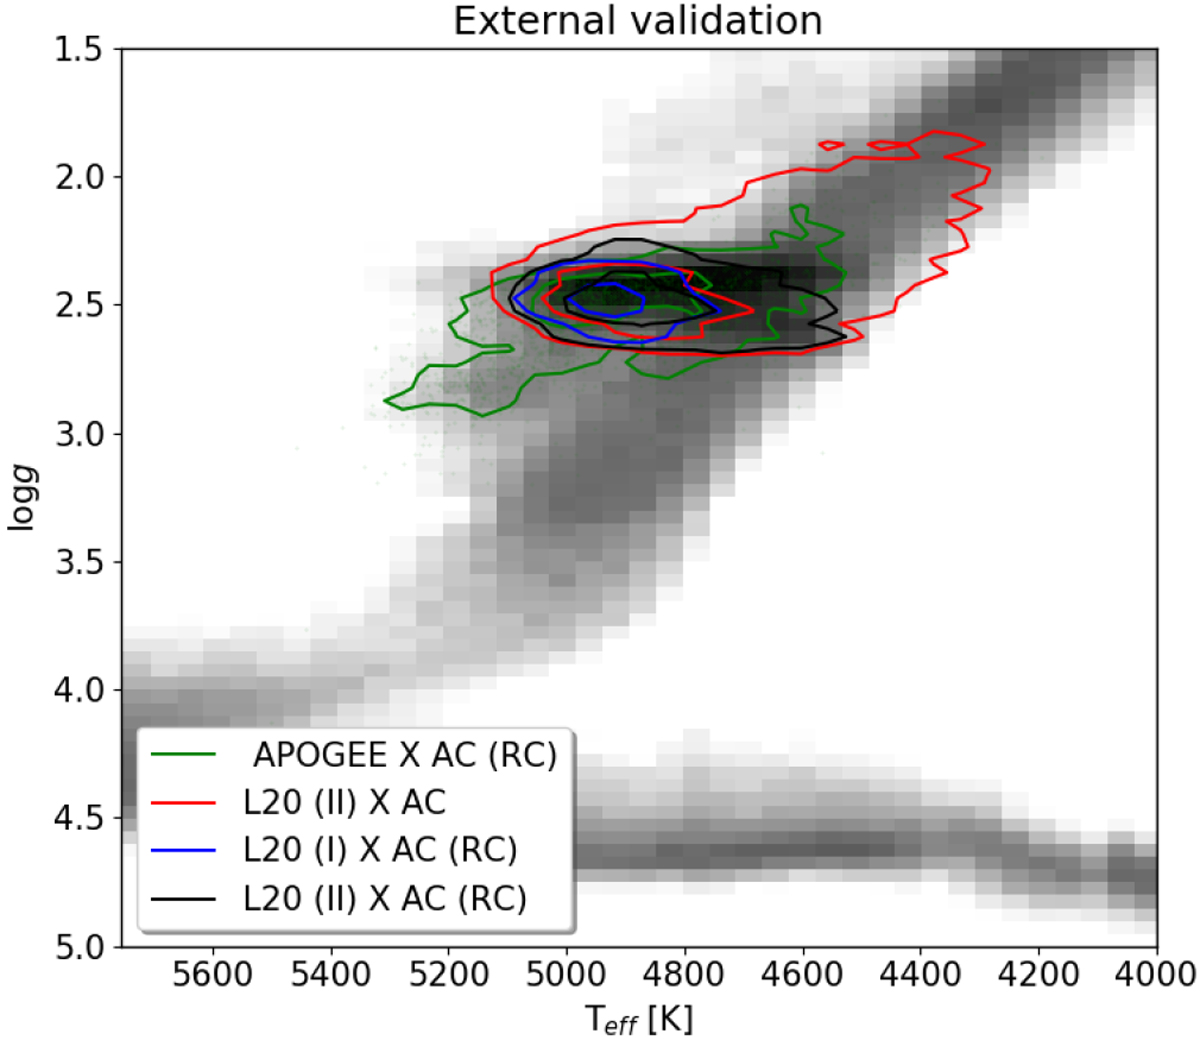
External validation comparing the distribution of the AC20 RC stars on a l Kiel diagram. In grey is the full distribution from APOGEE-DR16, and the green contours show common stars between our RC sample and APOGEE-DR16. Red contours show common stars between L20 and the entire anticentre sample used here. The blue contours show common stars between L20-‘Tier I’ (i.e. 20% contamination) and our RC sample. The black contours show common stars between L20-‘Tier II’ (i.e. 33% contamination) and our RC sample.
Current usage metrics show cumulative count of Article Views (full-text article views including HTML views, PDF and ePub downloads, according to the available data) and Abstracts Views on Vision4Press platform.
Data correspond to usage on the plateform after 2015. The current usage metrics is available 48-96 hours after online publication and is updated daily on week days.
Initial download of the metrics may take a while.