Fig. 21
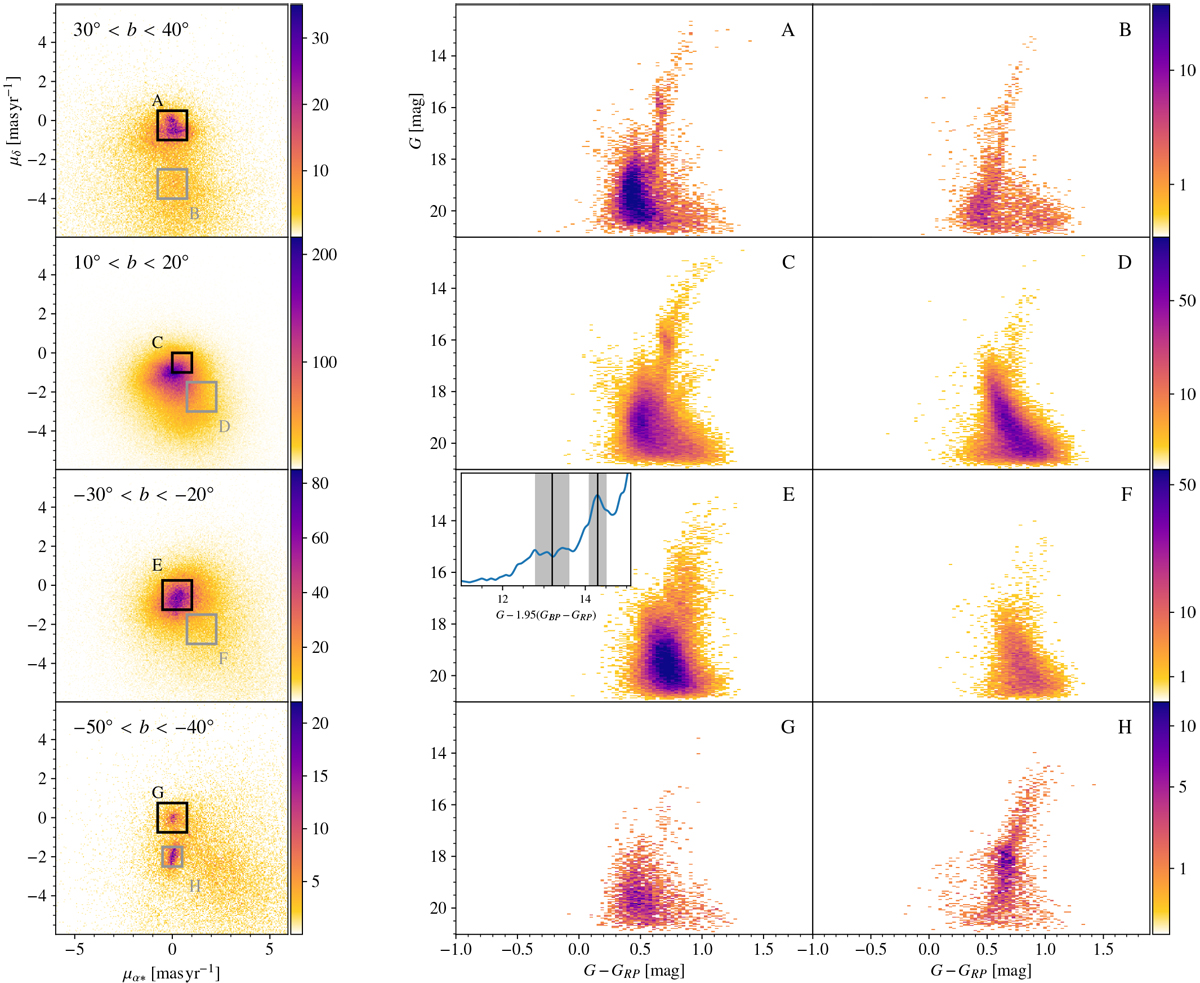
Colour-magnitude diagrams of different features in the anticentre. The diagrams are for the kinematic groups selected in proper motion in the range 170 deg < ℓ < 190 deg. Each row corresponds to a different latitude. First column: distribution in proper motion and the definition of two regions of interested. The stellar population in these selections are shown in the second and third columns. We see structures such as ACS (A), Monoceros (C), the Sagittarius stream (H, C) and other outer disc structures (E).
Current usage metrics show cumulative count of Article Views (full-text article views including HTML views, PDF and ePub downloads, according to the available data) and Abstracts Views on Vision4Press platform.
Data correspond to usage on the plateform after 2015. The current usage metrics is available 48-96 hours after online publication and is updated daily on week days.
Initial download of the metrics may take a while.