Fig. 19
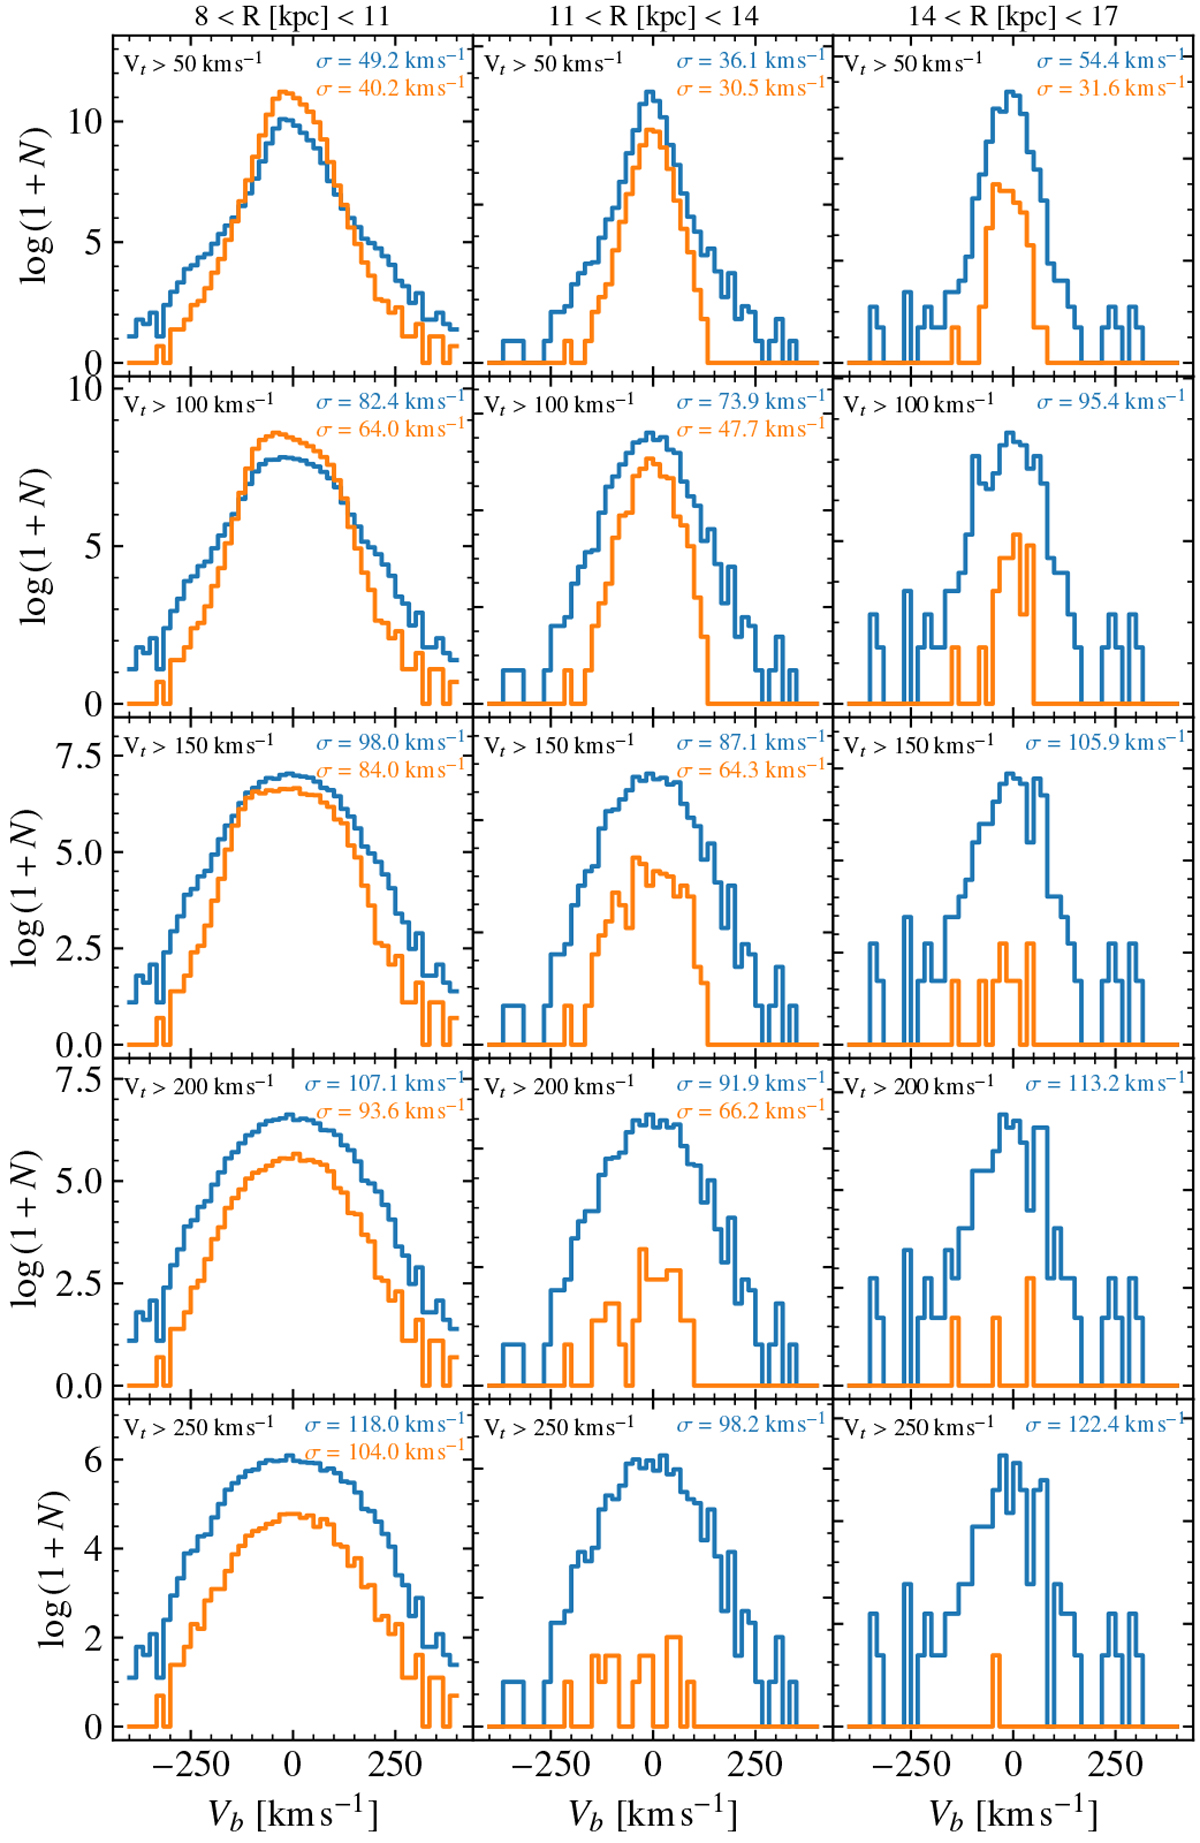
Vertical tangential velocities Vb for the blue and red sequences. The plots are for different distance slices, indicated in the top of each column. Each row shows a different Vt selection, indicated in each panel. The blue (orange) curve shows the distribution for the blue (red) sequence. The different relative contribution of the sequences in the different panels is indicative of the spatial distribution of the accreted component and the ancient heated disc, and in particular of a shorter extent of the later one.
Current usage metrics show cumulative count of Article Views (full-text article views including HTML views, PDF and ePub downloads, according to the available data) and Abstracts Views on Vision4Press platform.
Data correspond to usage on the plateform after 2015. The current usage metrics is available 48-96 hours after online publication and is updated daily on week days.
Initial download of the metrics may take a while.