Fig. 18
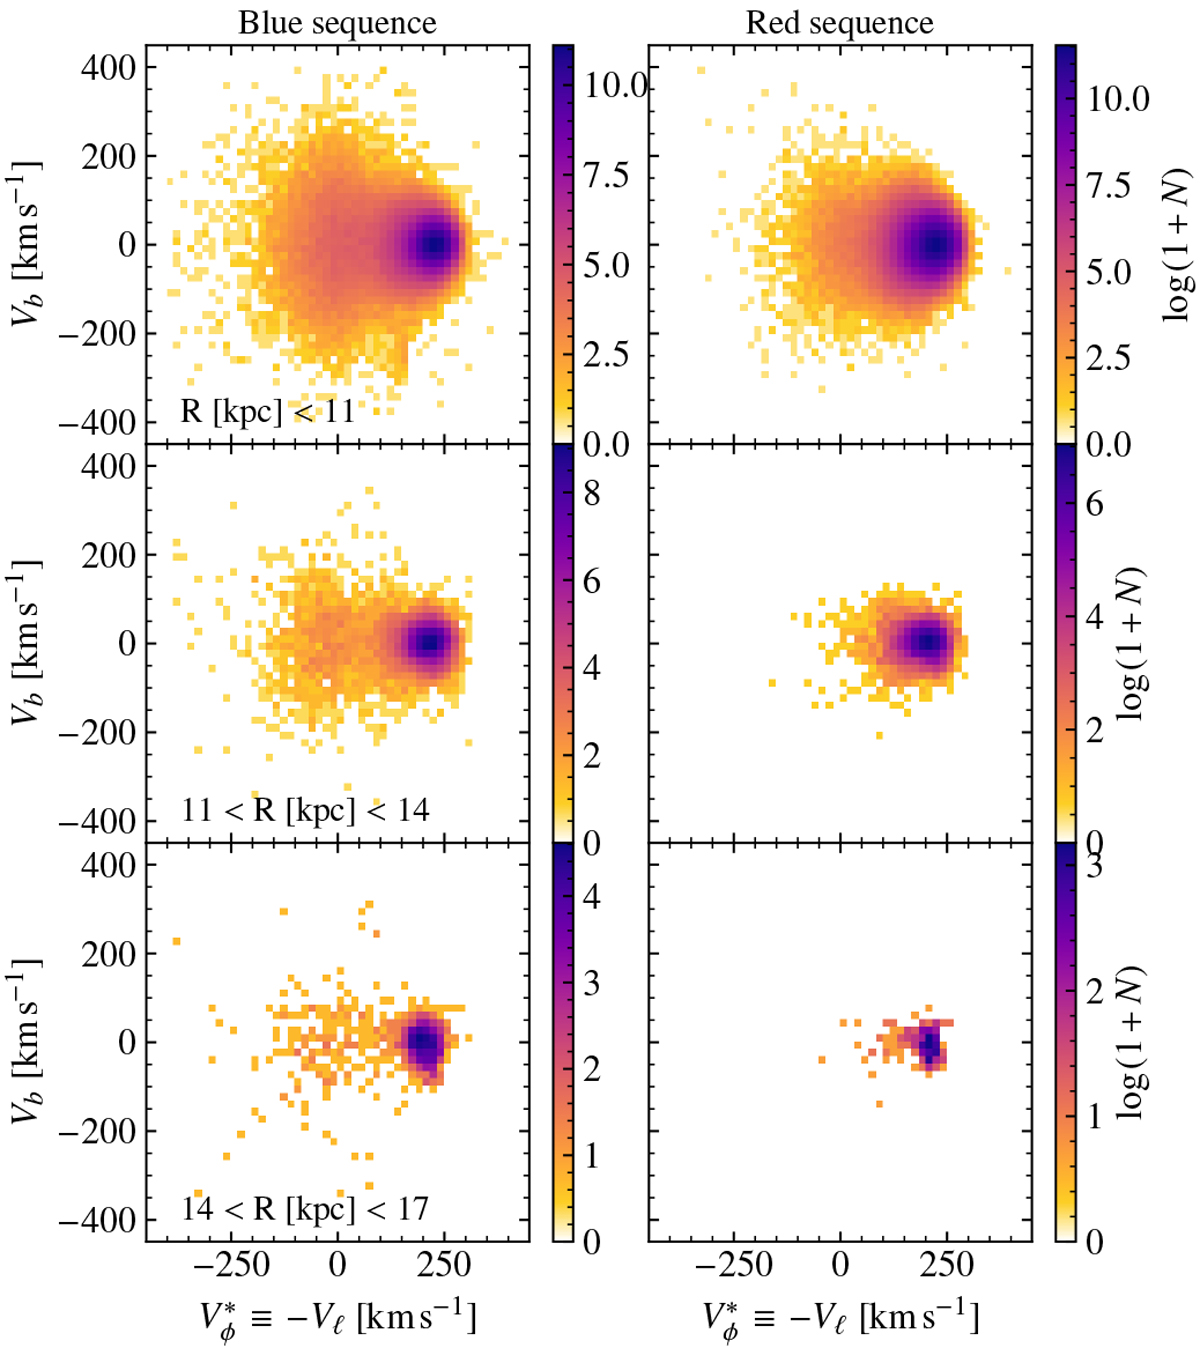
Velocity distribution of the blue and red sequences. ![]() vs. Vb distribution showing in the left (right) column the stars in the blue (red) sequence. Each row shows the distributions for a given distance slice, indicated in the left panels. The stars with low rotation (even the retrogrades ones) are far more prominent in the blue sequence and extend to larger Galactocentric radii.
vs. Vb distribution showing in the left (right) column the stars in the blue (red) sequence. Each row shows the distributions for a given distance slice, indicated in the left panels. The stars with low rotation (even the retrogrades ones) are far more prominent in the blue sequence and extend to larger Galactocentric radii.
Current usage metrics show cumulative count of Article Views (full-text article views including HTML views, PDF and ePub downloads, according to the available data) and Abstracts Views on Vision4Press platform.
Data correspond to usage on the plateform after 2015. The current usage metrics is available 48-96 hours after online publication and is updated daily on week days.
Initial download of the metrics may take a while.