Fig. 17
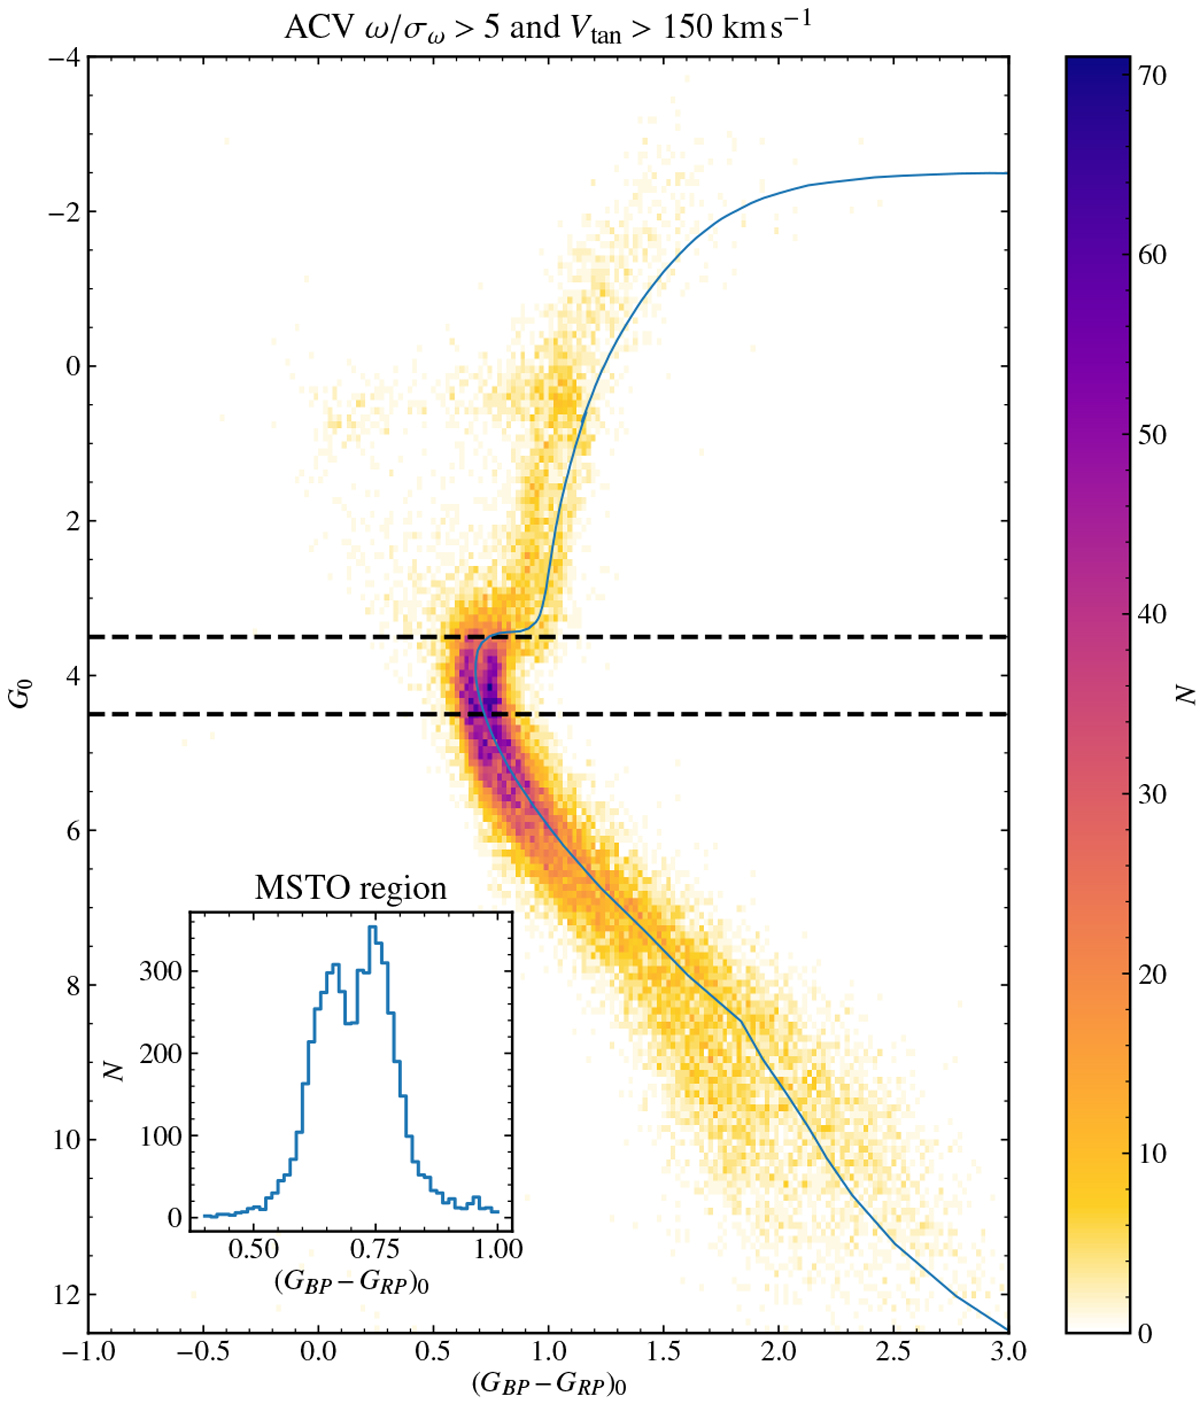
Red and blue sequences for high tangential velocity stars. GRP − GBP vs. G Hess diagram for the ACV sample with |b| < 40 deg and with a ϖ∕σϖ > 5 and Vt > 150 km s−1. A PARSEC isochrone with [M/H] = −0.5 and age of 11 Gyr is shown in blue (but shifted by 0.04 in colour and 0.2 in magnitude in order to match the gap between blue and red sequences). The inset histogram shows the colour distribution in the magnitude range of the MSTO (shown as dashed lines in the main figure). A clear separation in two sequences is clearly seen as originally noted in Gaia Collaboration (2018a) with DR2 data. An animated version of this figure for varying Vt limits is available online.
Current usage metrics show cumulative count of Article Views (full-text article views including HTML views, PDF and ePub downloads, according to the available data) and Abstracts Views on Vision4Press platform.
Data correspond to usage on the plateform after 2015. The current usage metrics is available 48-96 hours after online publication and is updated daily on week days.
Initial download of the metrics may take a while.