Fig. 16
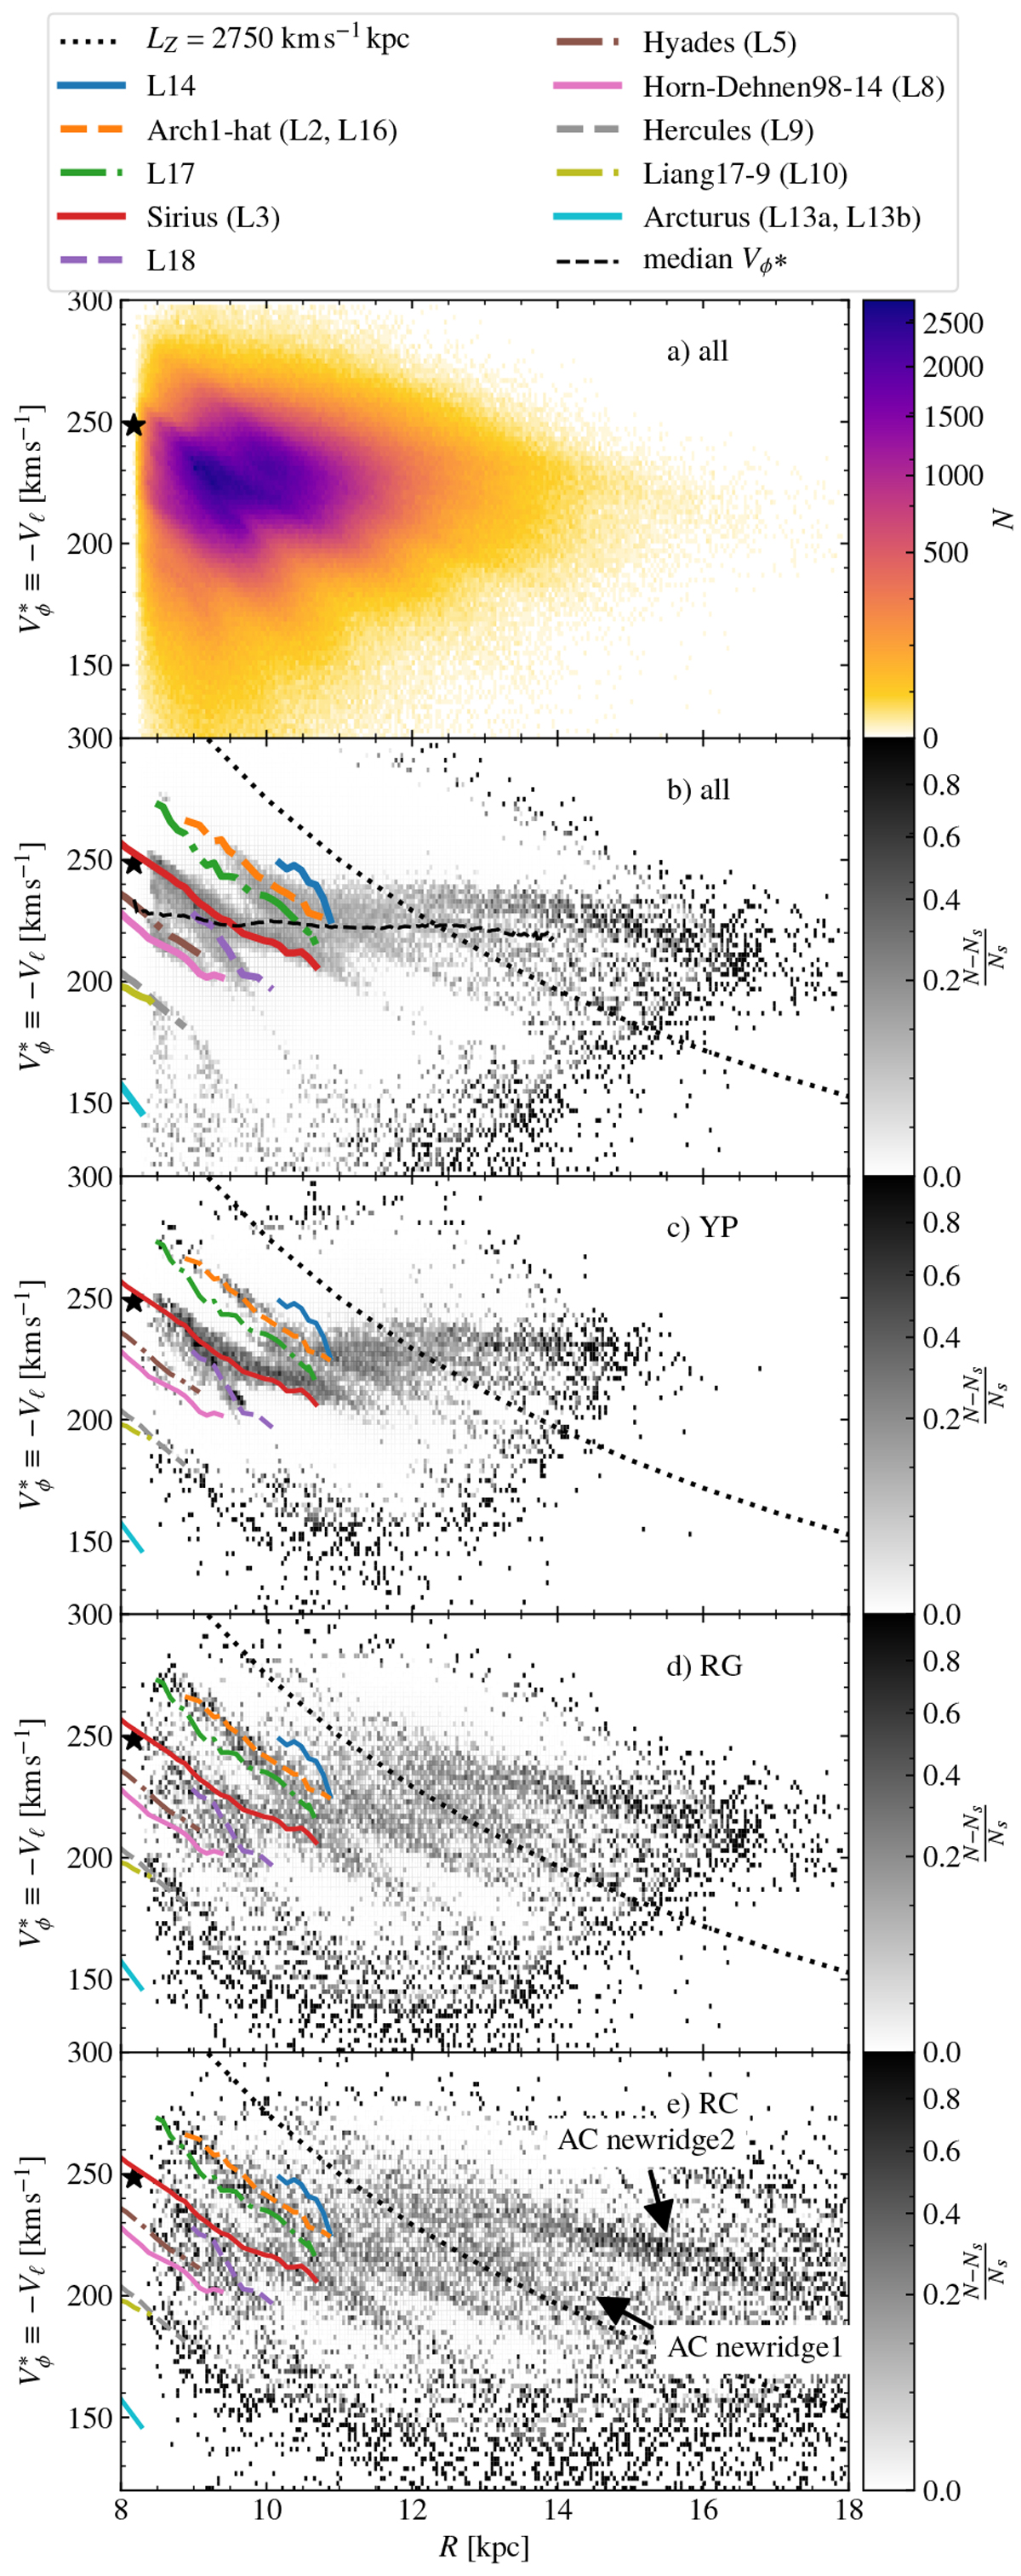
Substructures in the R-![]() projection inthe anticentre direction. (a) Number counts in the R-
projection inthe anticentre direction. (a) Number counts in the R-![]() plane in binsof size ΔR = 0.02 kpc and
plane in binsof size ΔR = 0.02 kpc and ![]() for all stars in the AC20-ϖ∕σϖ > 3 sample. (b) Same but applying a substructure mask to highlight the ridges (see text). (c–e) Same as b but for different stellar types. We also plot: some ridges from Ramos et al. (2018) with coloured lines, the separation of the bimodality (black dotted line), and the median velocity (black dashed line in panel b). We see the ridges extending beyond their limits in DR2 and new ridges resolved here for the first time.
for all stars in the AC20-ϖ∕σϖ > 3 sample. (b) Same but applying a substructure mask to highlight the ridges (see text). (c–e) Same as b but for different stellar types. We also plot: some ridges from Ramos et al. (2018) with coloured lines, the separation of the bimodality (black dotted line), and the median velocity (black dashed line in panel b). We see the ridges extending beyond their limits in DR2 and new ridges resolved here for the first time.
Current usage metrics show cumulative count of Article Views (full-text article views including HTML views, PDF and ePub downloads, according to the available data) and Abstracts Views on Vision4Press platform.
Data correspond to usage on the plateform after 2015. The current usage metrics is available 48-96 hours after online publication and is updated daily on week days.
Initial download of the metrics may take a while.