Fig. 15
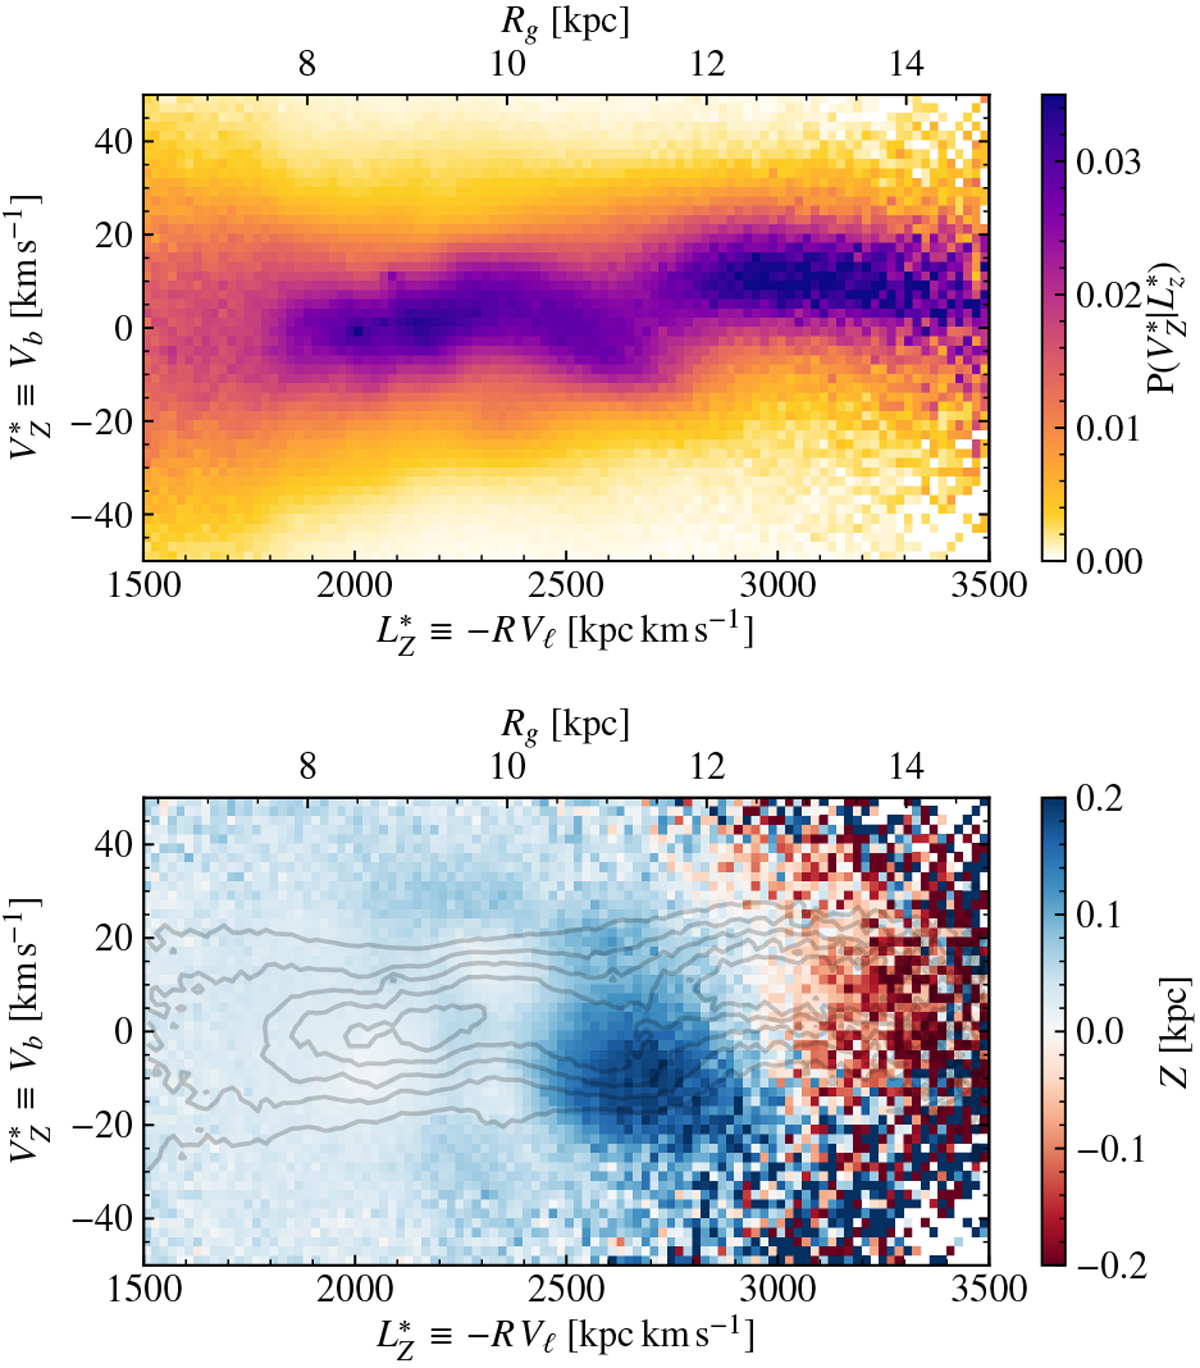
Structures in vertical velocity and angular momentum. Top: column normalised histogram of star numbers in the
![]() -
-![]() plane for the AC20-ϖ∕σϖ > 3 sample (the colour represents the fraction of stars in a given
plane for the AC20-ϖ∕σϖ > 3 sample (the colour represents the fraction of stars in a given ![]() bin that have a certain
bin that have a certain ![]() ).
Bottom: average Z
of stars in each bin in
).
Bottom: average Z
of stars in each bin in ![]() -
-![]() in our AC20-ϖ∕σϖ > 3 sample. Contours are the same as the colour plot in the top panel. To guide the eye, we also show an approximate guiding radius
in our AC20-ϖ∕σϖ > 3 sample. Contours are the same as the colour plot in the top panel. To guide the eye, we also show an approximate guiding radius ![]() .
.
Current usage metrics show cumulative count of Article Views (full-text article views including HTML views, PDF and ePub downloads, according to the available data) and Abstracts Views on Vision4Press platform.
Data correspond to usage on the plateform after 2015. The current usage metrics is available 48-96 hours after online publication and is updated daily on week days.
Initial download of the metrics may take a while.