Fig. 14
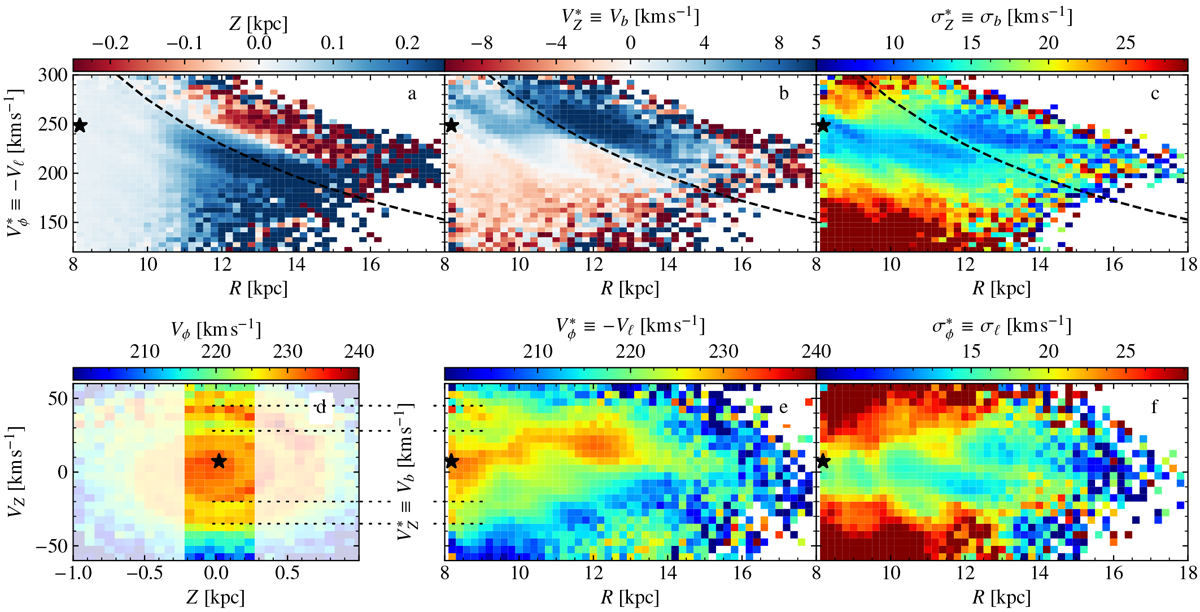
Phase space projections of the Galaxy disc. The plots show for the AC20-ϖ∕σϖ > 3 sample: (a) median Z
coordinate in the R-![]() plane; (b) median vertical velocity
plane; (b) median vertical velocity ![]() in the same projection; (c) dispersion inthe
in the same projection; (c) dispersion inthe ![]() velocity in the same projection (computed as the 1.5MAD); (d) phase spiral in the 6dsample in EDR3 for stars in the Galactic radial range
|R − R0| < 0.2 kpc; (e) median azimuthal velocity
velocity in the same projection (computed as the 1.5MAD); (d) phase spiral in the 6dsample in EDR3 for stars in the Galactic radial range
|R − R0| < 0.2 kpc; (e) median azimuthal velocity ![]() in the R-
in the R-![]() plane; (f) dispersion in
plane; (f) dispersion in![]() in thesame plane. The bimodality appears in the outer parts of the disc in
panels a–c, with the separation marked with a line of constant angular momentum
in thesame plane. The bimodality appears in the outer parts of the disc in
panels a–c, with the separation marked with a line of constant angular momentum
![]() .
Panel e:evolution of a slice of the phase spiral (marked in brighter colours in panel d) is seen for smaller radii, while a signature related to the above bimodality is seen beyond
~ 12 kpc in panels e and f.
.
Panel e:evolution of a slice of the phase spiral (marked in brighter colours in panel d) is seen for smaller radii, while a signature related to the above bimodality is seen beyond
~ 12 kpc in panels e and f.
Current usage metrics show cumulative count of Article Views (full-text article views including HTML views, PDF and ePub downloads, according to the available data) and Abstracts Views on Vision4Press platform.
Data correspond to usage on the plateform after 2015. The current usage metrics is available 48-96 hours after online publication and is updated daily on week days.
Initial download of the metrics may take a while.