Fig. 12
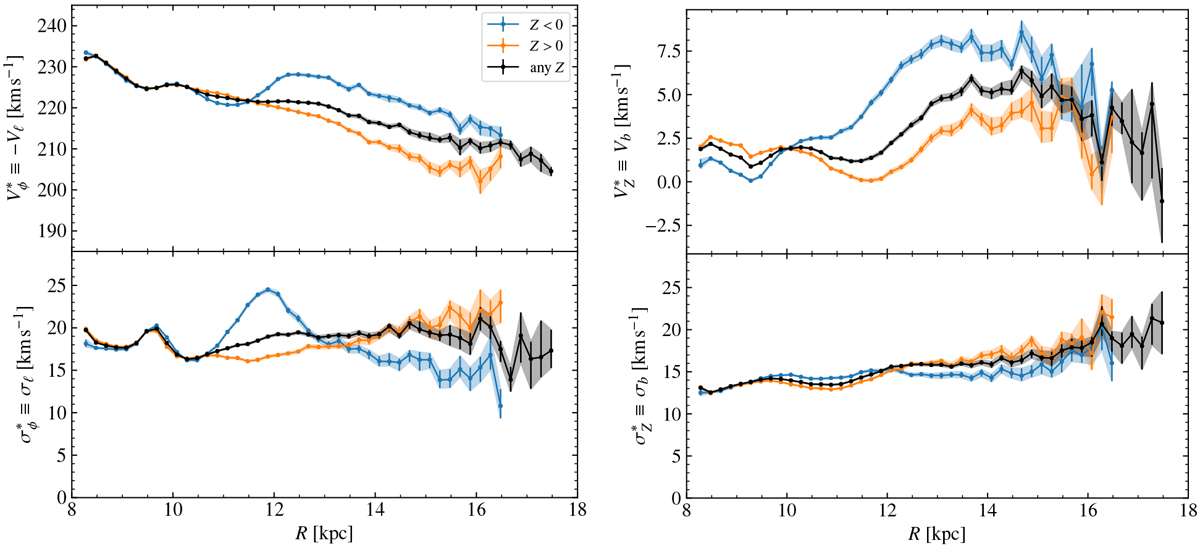
Comparisons of the velocities above and below the Galactic plane. We plot the median azimuthal and vertical velocities (top) and velocity dispersions (computed as 1.5MAD values, bottom) for the whole sample AC20-ϖ∕σϖ > 3 (black lines, not including the sample of RC with photometrically derived distances), and for stars with Z ≥ 0 (orange lines) and for Z < 0 stars (blue lines). Shaded areas represent the uncertainties. We observe notable asymmetries beyond 10–11 kpc.
Current usage metrics show cumulative count of Article Views (full-text article views including HTML views, PDF and ePub downloads, according to the available data) and Abstracts Views on Vision4Press platform.
Data correspond to usage on the plateform after 2015. The current usage metrics is available 48-96 hours after online publication and is updated daily on week days.
Initial download of the metrics may take a while.