Fig. 10
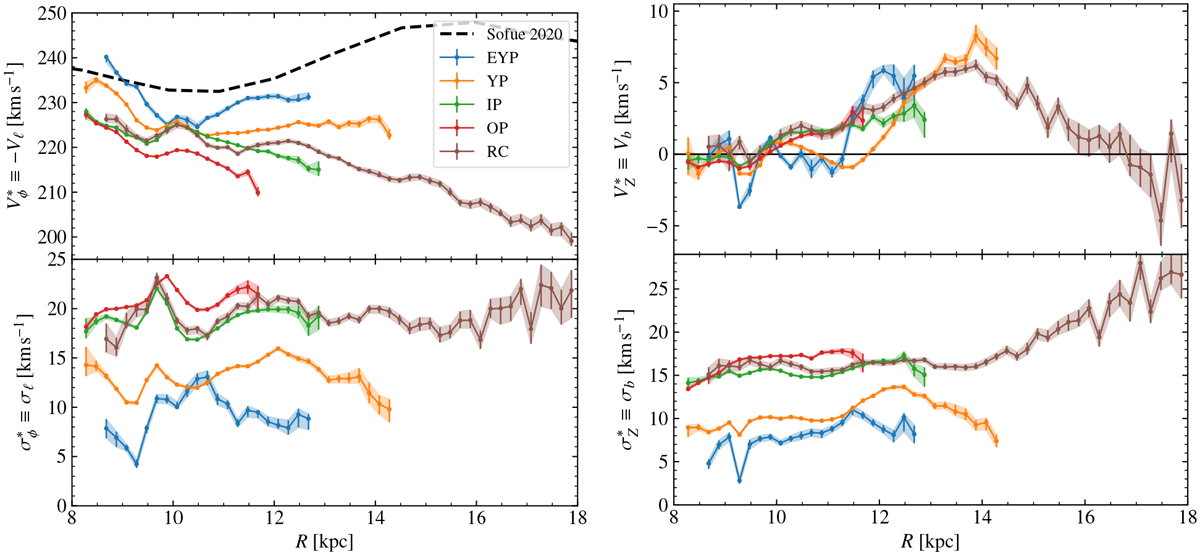
Rotation and vertical velocity profiles in the anticentre. Top: median azimuthal and vertical velocities of the populations EYP, YP, IP, OP and RC as indicated in the legends (same as in Fig. 7). Shaded areas represent the uncertainties (see text) but they are very small and barely visible in most of the cases. The rotation curve by Sofue (2020) is over-plotted in the top left panel. Bottom: same as top but for the velocity dispersions (computed as 1.5MAD values). Apart from the expected differences due to the different ages of the populations and the asymmetric drift, we seesignificant oscillations in all curves.
Current usage metrics show cumulative count of Article Views (full-text article views including HTML views, PDF and ePub downloads, according to the available data) and Abstracts Views on Vision4Press platform.
Data correspond to usage on the plateform after 2015. The current usage metrics is available 48-96 hours after online publication and is updated daily on week days.
Initial download of the metrics may take a while.