Fig. 7
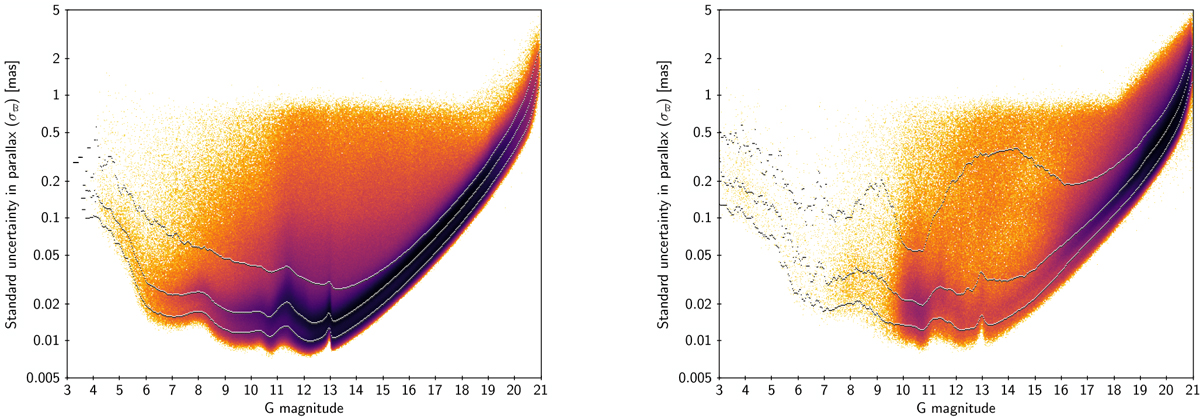
Uncertainty in parallax versus magnitude. Left: five-parameter solutions. Right: six-parameter solutions. The plots include all sources with G < 11.5 and a geometrically decreasing random fraction of the fainter sources, so as to give a roughly constant number of sources per magnitude interval. The colour scale from yellow to black indicates an increasing density of data points in the diagram. The curves show the 10th, 50th, and 90th percentiles of the distribution at a given magnitude.
Current usage metrics show cumulative count of Article Views (full-text article views including HTML views, PDF and ePub downloads, according to the available data) and Abstracts Views on Vision4Press platform.
Data correspond to usage on the plateform after 2015. The current usage metrics is available 48-96 hours after online publication and is updated daily on week days.
Initial download of the metrics may take a while.