Fig. 4
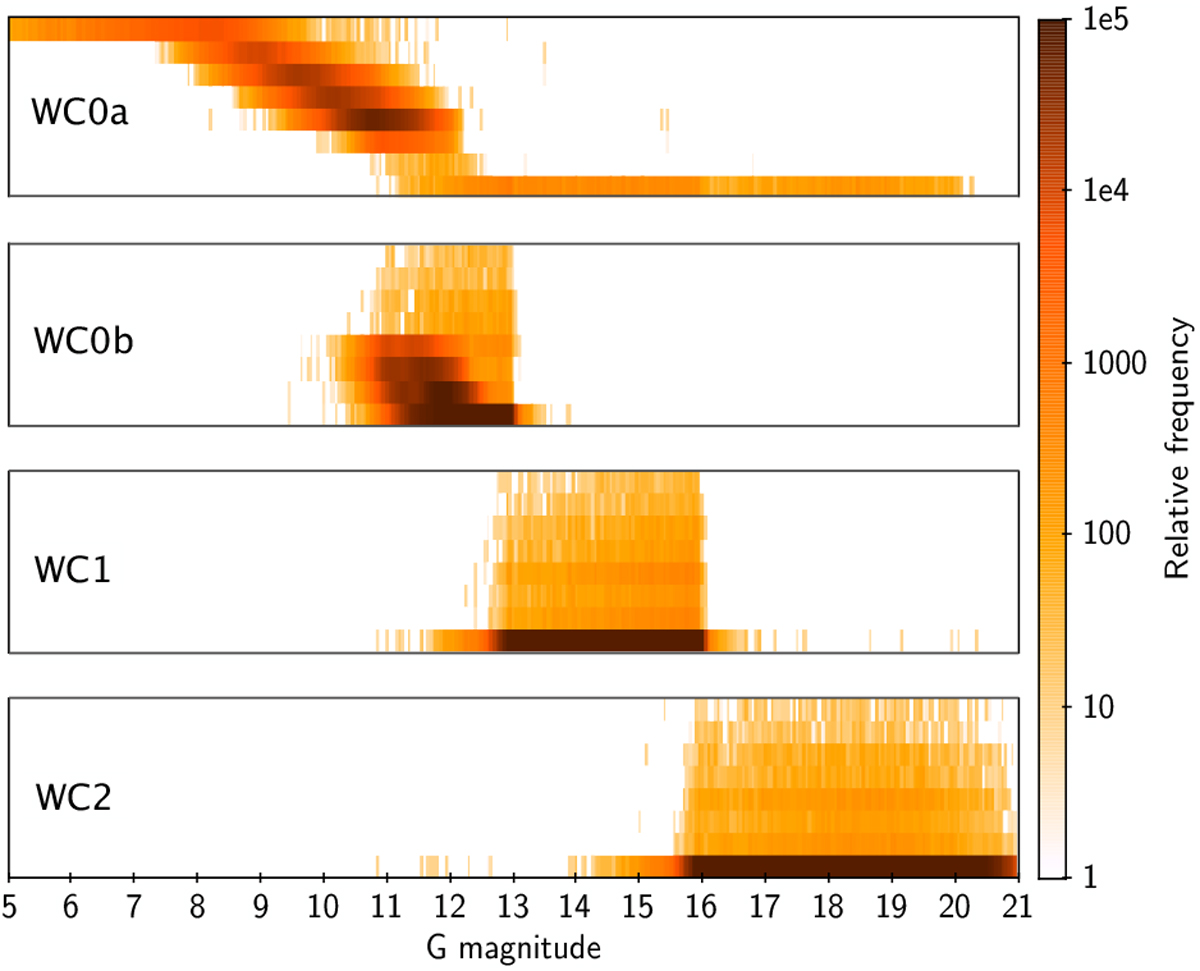
Relative frequency of observations in the various combinations of window class and gate, as a function of magnitude. The four blocks represent the four window classes (WC); within each WC the eight stripes represent (from top to bottom) gate number 4, 7, 8, 9, 10, 11, 12, and 0. The graph was constructed from a random 1% sample of the AF observations of the primary sources. The faint sources observed in WC0a at gate 0 are the Calibration Faint Stars, a small fraction of faint observations receiving full-pixel resolution windows for calibration purposes (Gaia Collaboration 2016a).
Current usage metrics show cumulative count of Article Views (full-text article views including HTML views, PDF and ePub downloads, according to the available data) and Abstracts Views on Vision4Press platform.
Data correspond to usage on the plateform after 2015. The current usage metrics is available 48-96 hours after online publication and is updated daily on week days.
Initial download of the metrics may take a while.