Fig. B.1
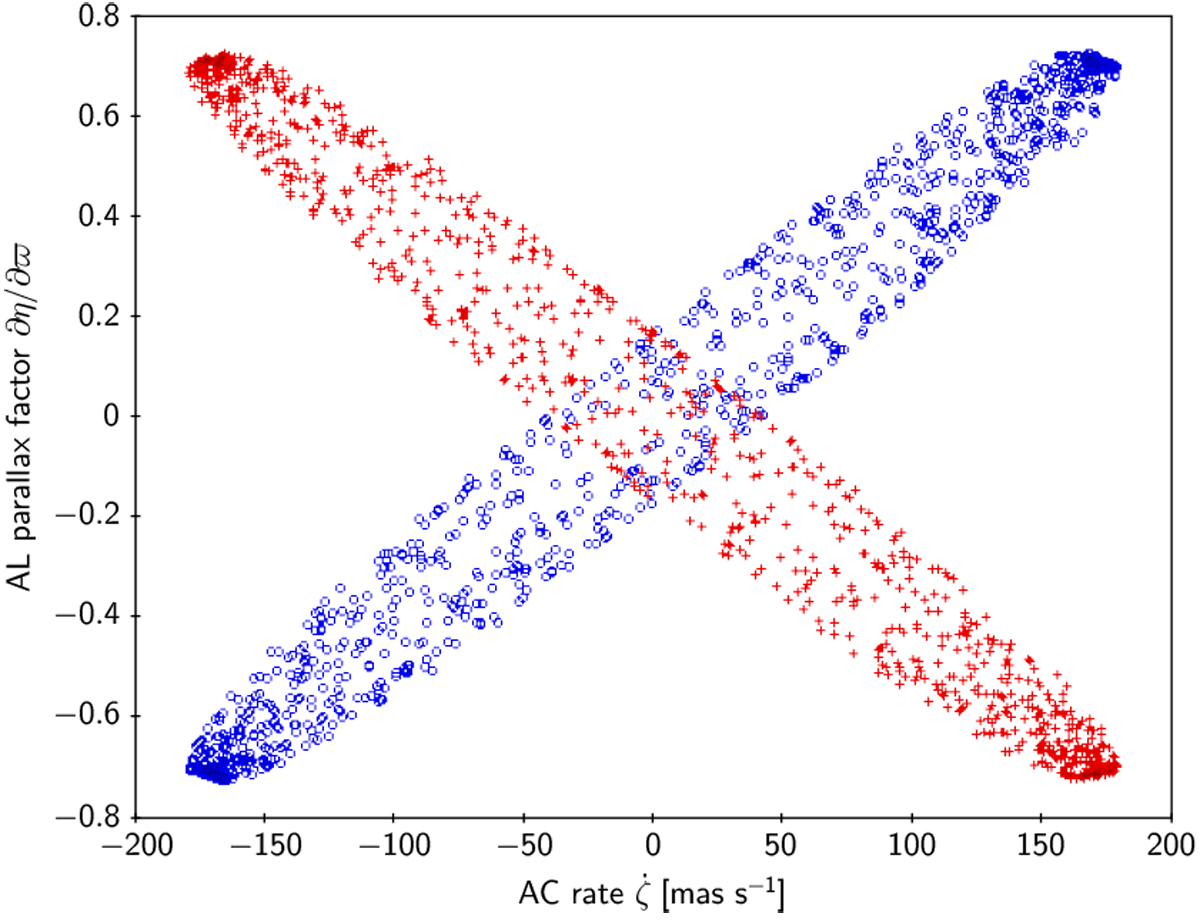
Correlation between AC rate and AL parallax factor. Blue circles show a random selection of 1000 FoV transits from data segments DS0–DS5, when the scanning law was in its normal (forward precession) mode. Red crosses show 1000 random transits from data segments DS6 and DS7, when the reversed precession mode was used. EDR3 is exclusively based on observations taken in the forward precession mode.
Current usage metrics show cumulative count of Article Views (full-text article views including HTML views, PDF and ePub downloads, according to the available data) and Abstracts Views on Vision4Press platform.
Data correspond to usage on the plateform after 2015. The current usage metrics is available 48-96 hours after online publication and is updated daily on week days.
Initial download of the metrics may take a while.