Fig. 15
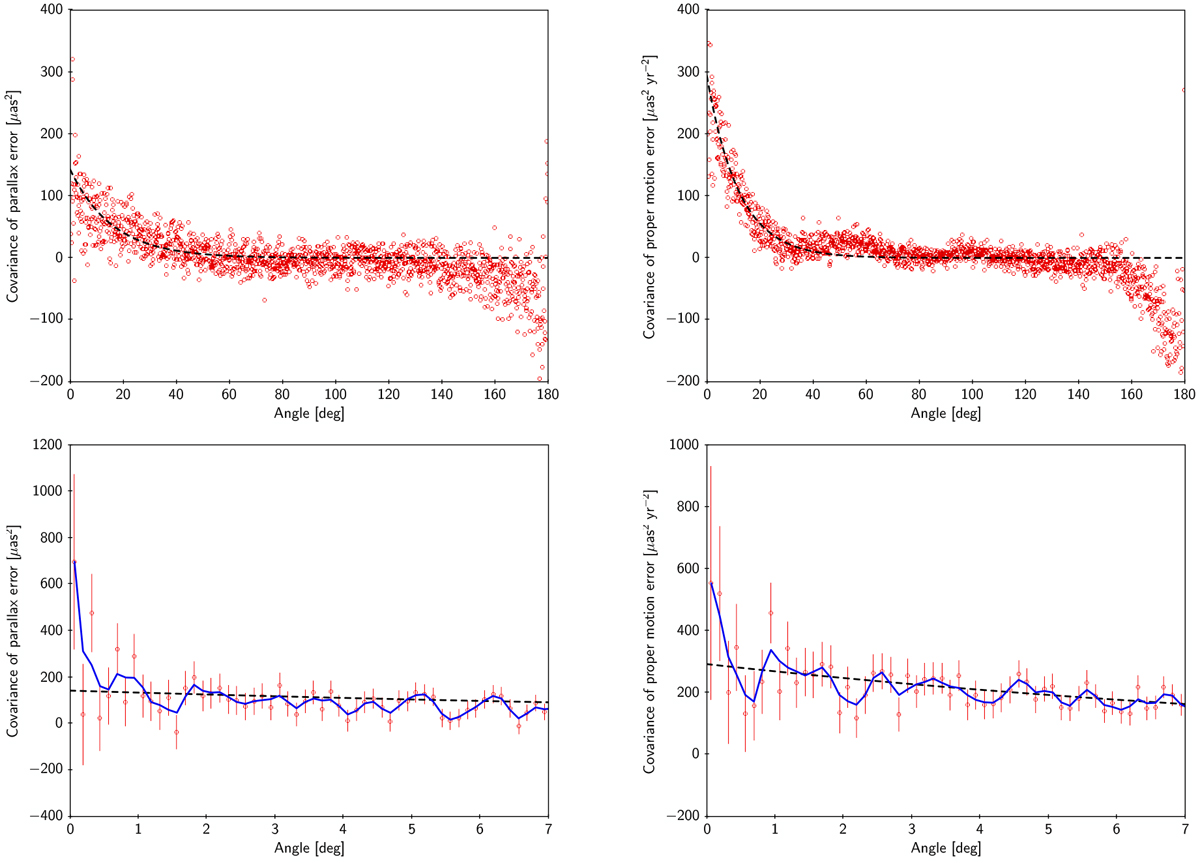
Angular covariances of the five-parameter quasar sample. Left: covariance in parallax, V ϖ (θ). Right: covariance in proper motion, V μ(θ). The red circles are the individual estimates; the dashed black curves are fitted exponential functions. The bottom panels show the same data as in the top panels, but for small separations only, with errors bars (68% confidence intervals) and running triangular mean values (blue curves).
Current usage metrics show cumulative count of Article Views (full-text article views including HTML views, PDF and ePub downloads, according to the available data) and Abstracts Views on Vision4Press platform.
Data correspond to usage on the plateform after 2015. The current usage metrics is available 48-96 hours after online publication and is updated daily on week days.
Initial download of the metrics may take a while.