Fig. 14
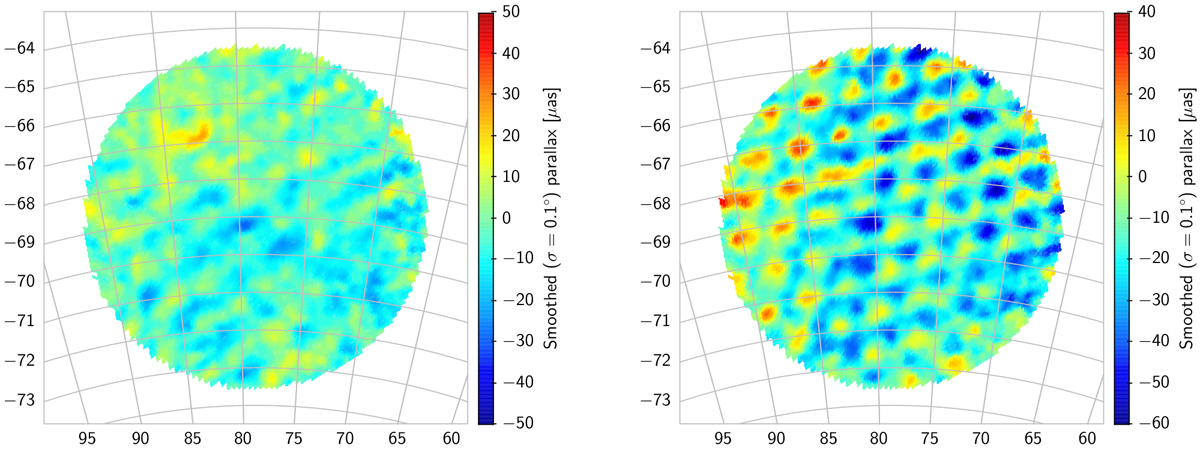
Smoothed maps of parallaxes in the LMC area, visualising small-scale systematics (the “checkered pattern”) in Gaia EDR3 and DR2. Left: smoothed parallaxes in EDR3 for sources in the magnitude range G = 16–18 (median G = 17.4), kinematically selected as probable members of the system (see Appendix B in Lindegren et al. 2021 for details). Right: smoothed parallaxes in DR2 for the same sample of sources. Both maps were smoothed using a Gaussian kernel with standard deviation 0.1°. While the sample includes about 730 000 sources within 5° radius of the adopted centre, only smoothed points within a radius of 4.5° are shown toavoid unwanted edge effects. Comparison between the two diagrams is facilitated by the use of the same colour scale, only shifted by 10 μas to compensate for the mean difference in parallax between DR2 and EDR3.
Current usage metrics show cumulative count of Article Views (full-text article views including HTML views, PDF and ePub downloads, according to the available data) and Abstracts Views on Vision4Press platform.
Data correspond to usage on the plateform after 2015. The current usage metrics is available 48-96 hours after online publication and is updated daily on week days.
Initial download of the metrics may take a while.