Fig. 8.
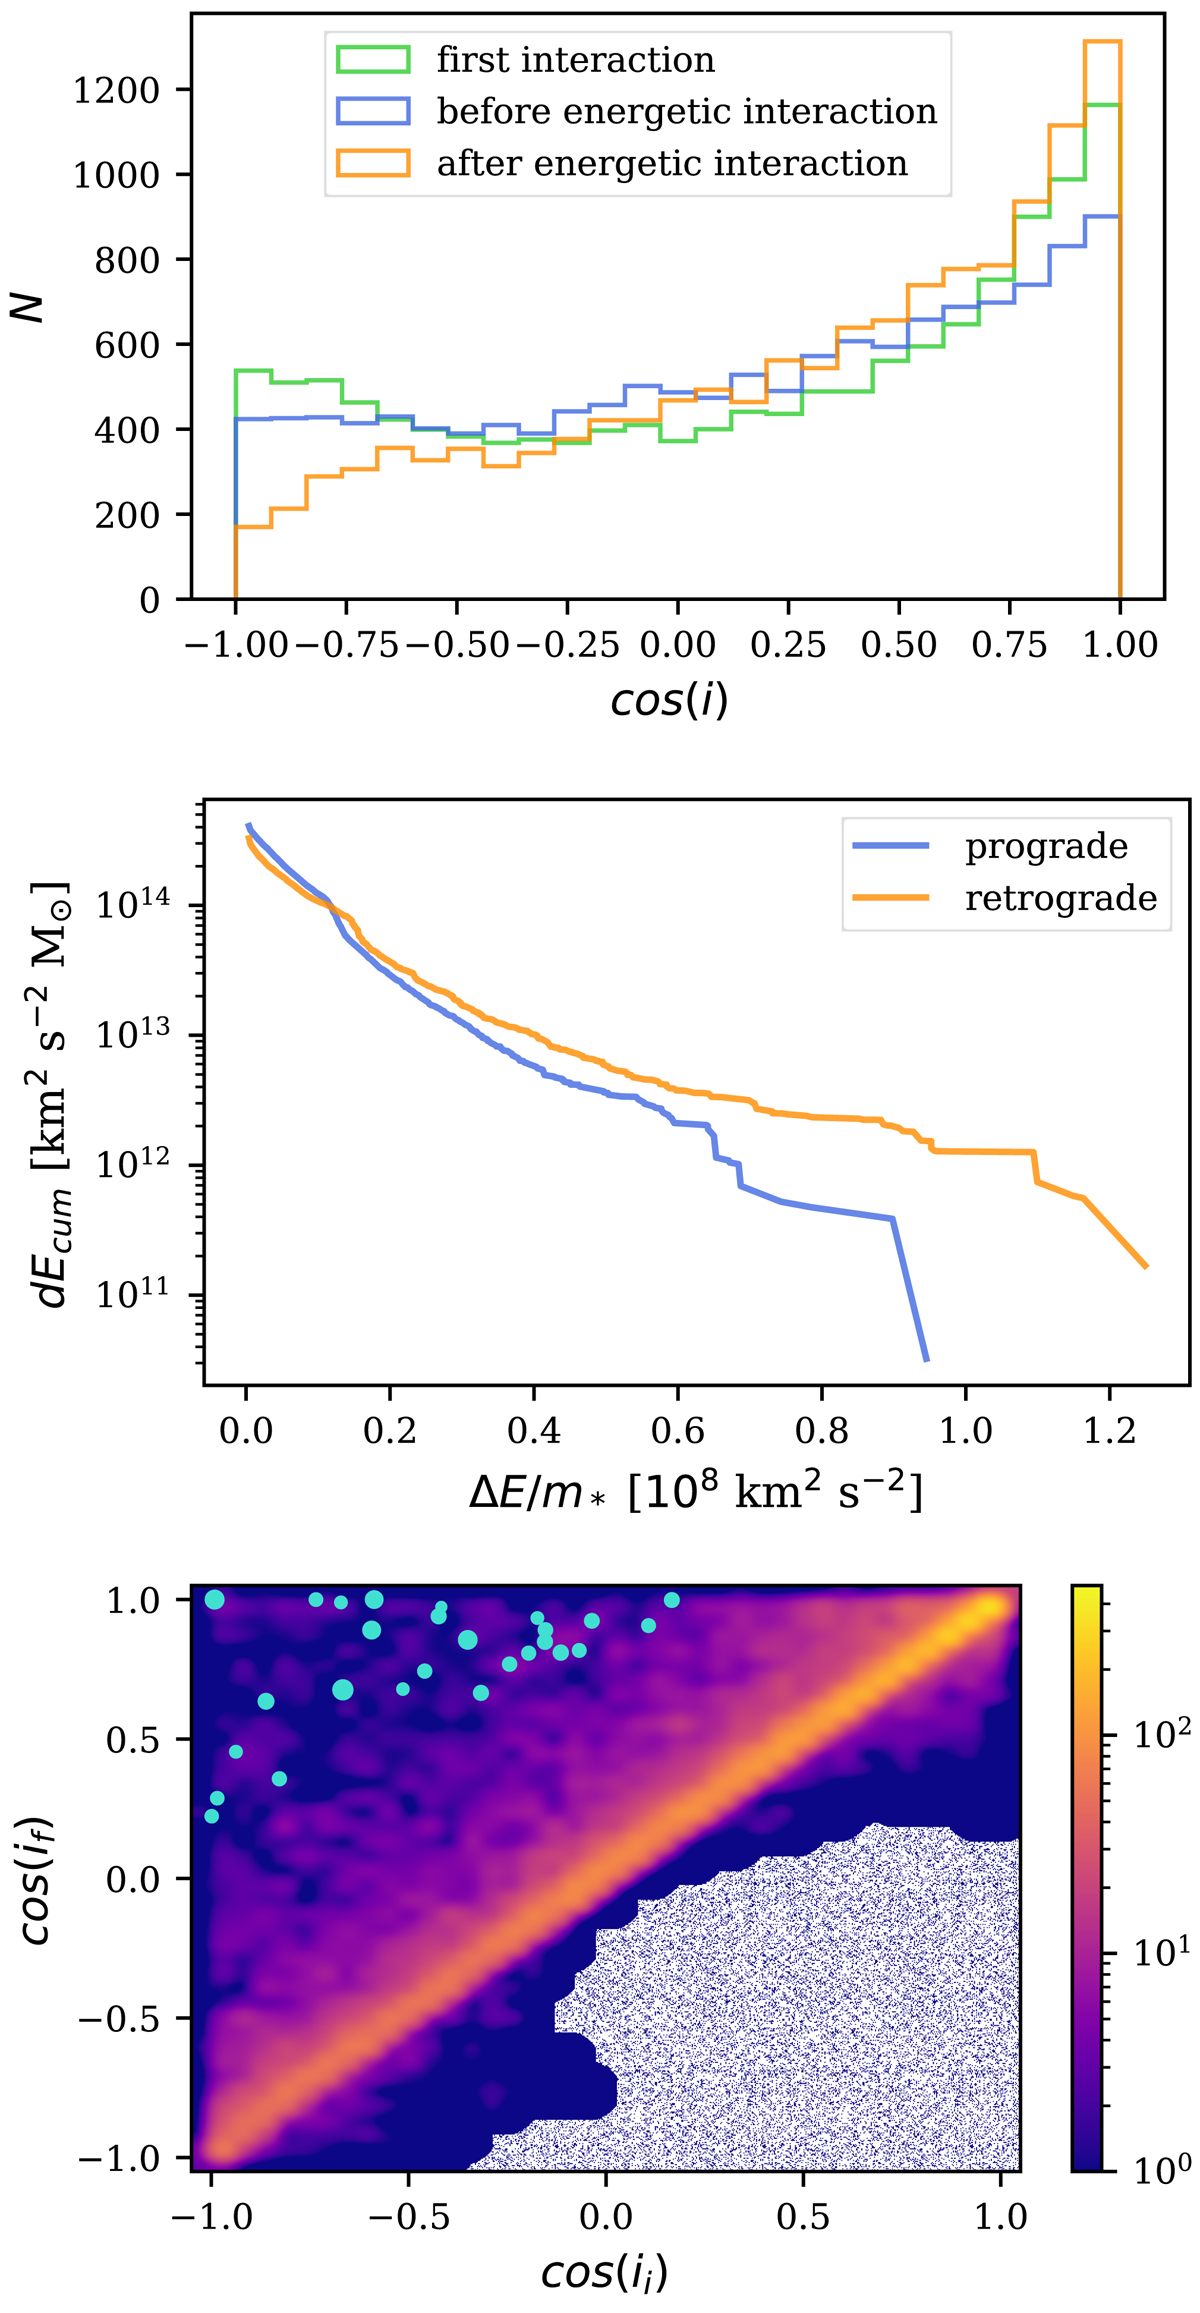
Top: distributions of orbital inclination of the encounters with respect to the black hole binary, at first passage (green) as well as before and after the energetic interaction (blue and orange lines, respectively). Middle: cumulatively summed maximum energy changes in prograde (blue) and retrograde (orange) orbits as a function of specific energy change. Bottom: two-dimensional histogram of the initial (x-axis) and final inclination (y-axis). The green points correspond to the 27 most energetic encounters (with ΔE/m* > 7.9 × 10⁷ [km2s−2]). The size of points is correlated with the total energy extracted.
Current usage metrics show cumulative count of Article Views (full-text article views including HTML views, PDF and ePub downloads, according to the available data) and Abstracts Views on Vision4Press platform.
Data correspond to usage on the plateform after 2015. The current usage metrics is available 48-96 hours after online publication and is updated daily on week days.
Initial download of the metrics may take a while.