Fig. 7.
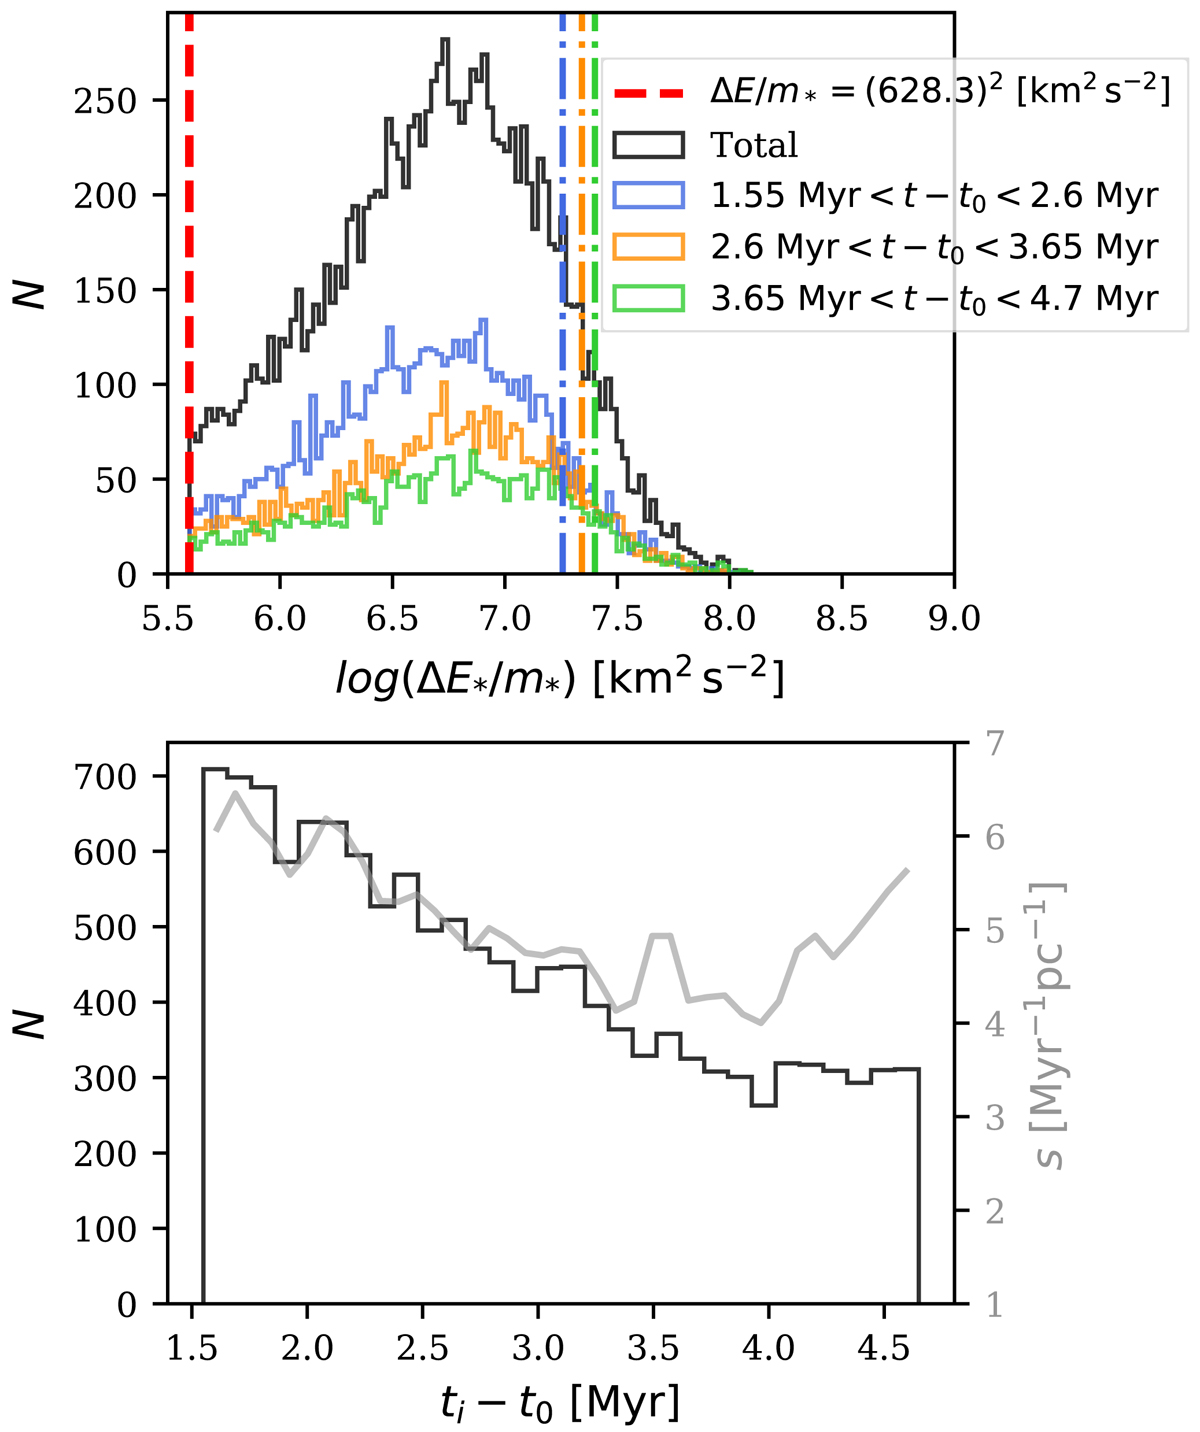
Top panel: in full lines, we present the distribution of specific energy changes in the interacting stars, where the colors correspond to different times throughout the run. The dash-dotted lines represent the expected typical specific energy changes of a star ejected by the binary at each time interval, given by Eq. (11). The red dashed line corresponds to the cut-off value we use to define the high-energy tail. Bottom panel: time distribution of the most energetic interactions for each interacting star, given in Myr since t0. In gray, the hardening rate (s) is given as a measure of energy extracted from the binary by the interaction. We notice that while the number of encounters decreases, the hardening rate remains largely constant.
Current usage metrics show cumulative count of Article Views (full-text article views including HTML views, PDF and ePub downloads, according to the available data) and Abstracts Views on Vision4Press platform.
Data correspond to usage on the plateform after 2015. The current usage metrics is available 48-96 hours after online publication and is updated daily on week days.
Initial download of the metrics may take a while.