Fig. 6.
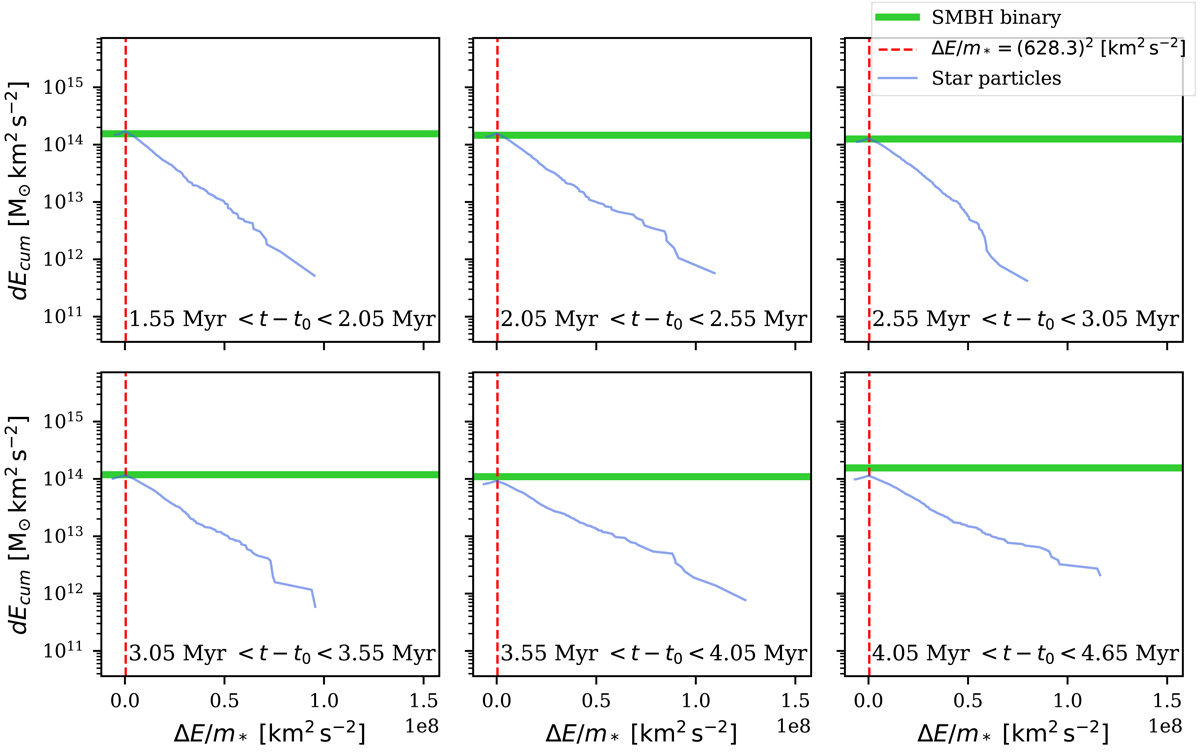
Energy balance plots showing the SMBH binary orbital energy changes compared to the cumulative energy changes of stellar particles for different times. The blue lines represent the cumulative energy changes of all stars that come within 10abh of the SMBH binary during the specified time period. The thick green line corresponds to the total SMBH binary orbital energy change for the same time period. The red dashed line corresponds to the cut-off value we use to define the high-energy tail.
Current usage metrics show cumulative count of Article Views (full-text article views including HTML views, PDF and ePub downloads, according to the available data) and Abstracts Views on Vision4Press platform.
Data correspond to usage on the plateform after 2015. The current usage metrics is available 48-96 hours after online publication and is updated daily on week days.
Initial download of the metrics may take a while.