Fig. 13.
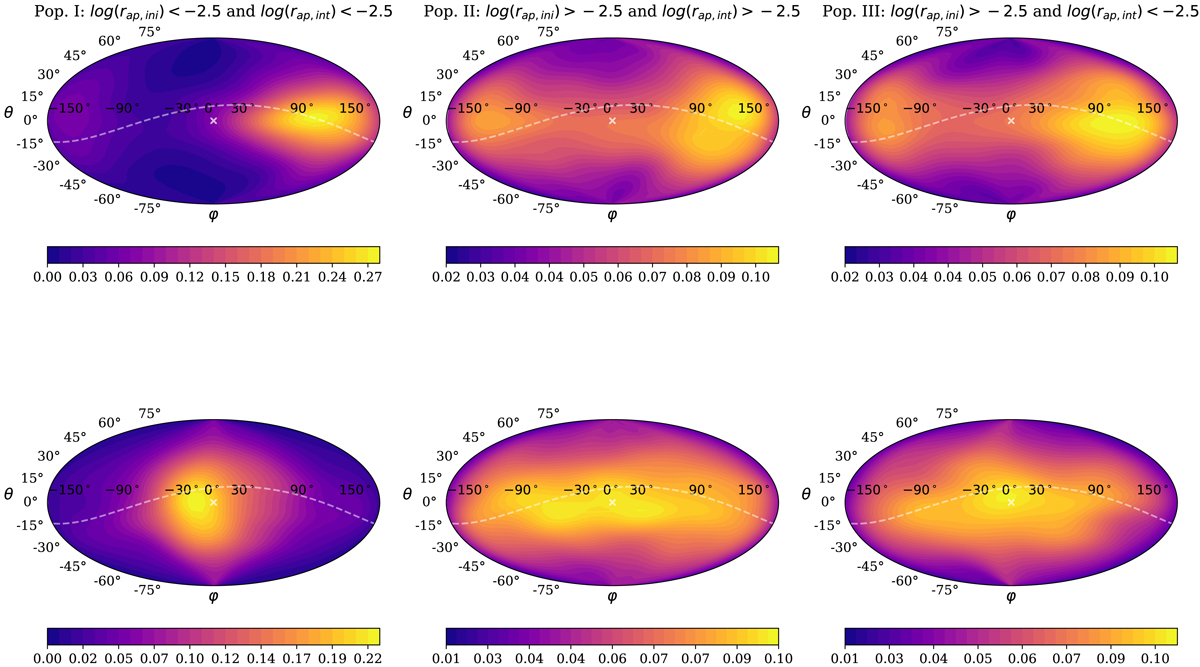
Top: angular ejection distribution of Populations I-III at the time of initial interaction with the binary. The figures are centered on the SMBH binary center of mass, with the gray line representing the projection of the SMBH binary orbit. The white cross corresponds to the direction of the origin of our comoving reference frame, where the potential is evaluated. The θ = 0 plane corresponds to the equatorial plane of the system. Bottom: angular ejection distribution after the most energetic interaction. Other elements in the plots are the same as in the top three plots.
Current usage metrics show cumulative count of Article Views (full-text article views including HTML views, PDF and ePub downloads, according to the available data) and Abstracts Views on Vision4Press platform.
Data correspond to usage on the plateform after 2015. The current usage metrics is available 48-96 hours after online publication and is updated daily on week days.
Initial download of the metrics may take a while.