Fig. 1.
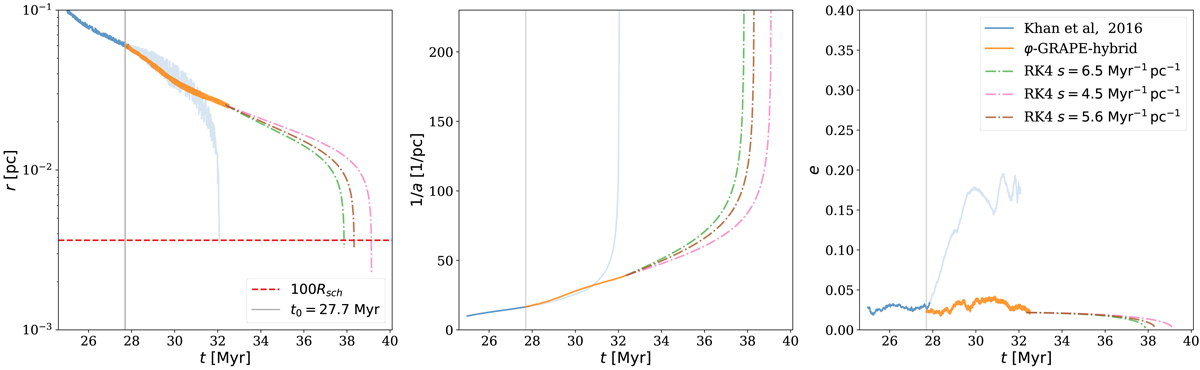
Left: separation of the black holes as a function of time since tini (since the particle splitting procedure). The blue line corresponds to the original run in Khan et al. (2016), while the orange line corresponds to our run. The light version of the blue line refers to the continuation of the original simulation data. The three dashed-dotted lines starting at 33.35 Myr correspond to analytical estimates of the merger time in the PN-dominated regime using constant values of hardening rate. The vertical line marks the initial time of our run, t0. The horizontal dashed line marks the separation of 100Rsch, where the Rsch is the Schwarzschild radius of the combined mass of both black holes. Middle: inverse of the binary semi-major axis used as a measure of hardening rate. Plot elements are the same as on the left plot. Right: eccentricity evolution of the SMBH binary. Plot elements are the same as on the left plot.
Current usage metrics show cumulative count of Article Views (full-text article views including HTML views, PDF and ePub downloads, according to the available data) and Abstracts Views on Vision4Press platform.
Data correspond to usage on the plateform after 2015. The current usage metrics is available 48-96 hours after online publication and is updated daily on week days.
Initial download of the metrics may take a while.