Fig. 9.
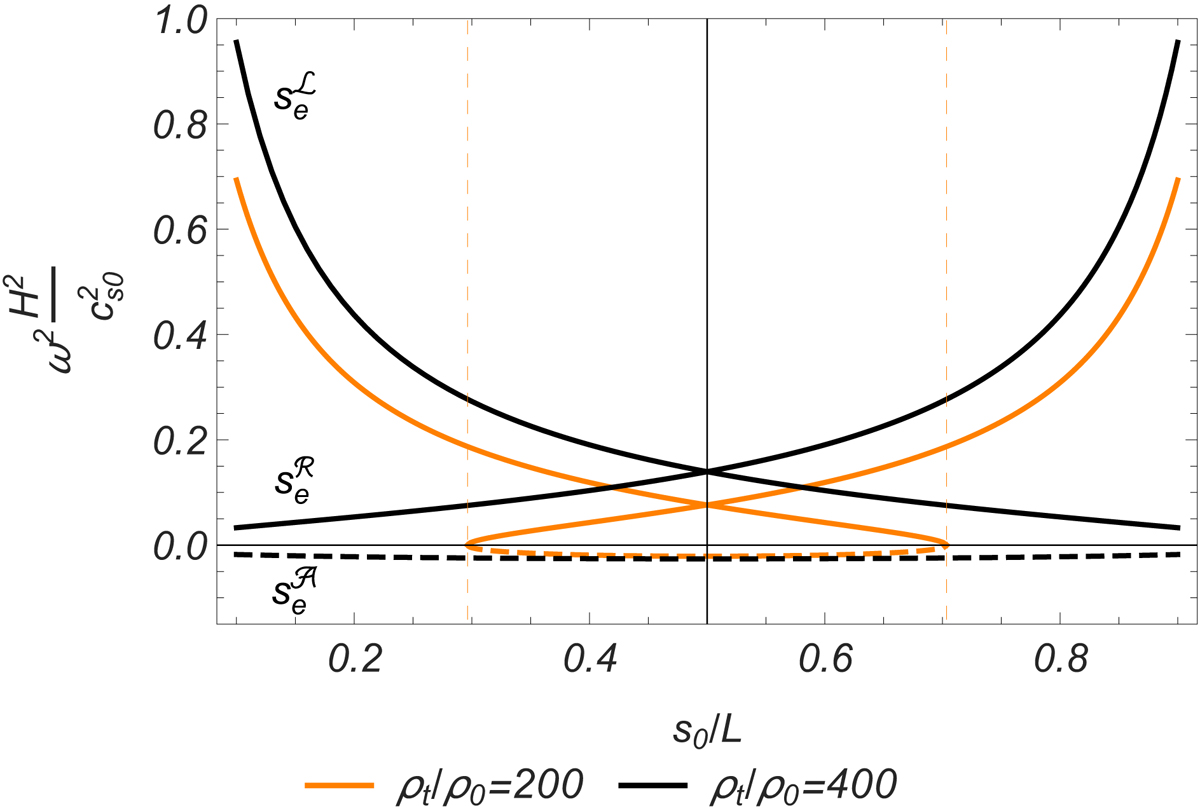
ω2 as a function of s0/L (Eq. (41)) for the three solutions obtained in Fig. 6. The solid lines correspond to ![]() (lines decreasing from left to right) and
(lines decreasing from left to right) and ![]() (lines increasing from left to right), and the dashed lines to
(lines increasing from left to right), and the dashed lines to ![]() . The horizontal line represents ω = 0 and divides the plot into stable and unstable solutions. In this plot the left and right solutions are stable while the near apex solution is unstable. The bifurcation points (vertical dashed lines) have been calculated by solving Eqs. (23) and (24) simultaneously, and it is equivalent to impose ω2 = 0 in Eq. (41) once se is known.
. The horizontal line represents ω = 0 and divides the plot into stable and unstable solutions. In this plot the left and right solutions are stable while the near apex solution is unstable. The bifurcation points (vertical dashed lines) have been calculated by solving Eqs. (23) and (24) simultaneously, and it is equivalent to impose ω2 = 0 in Eq. (41) once se is known.
Current usage metrics show cumulative count of Article Views (full-text article views including HTML views, PDF and ePub downloads, according to the available data) and Abstracts Views on Vision4Press platform.
Data correspond to usage on the plateform after 2015. The current usage metrics is available 48-96 hours after online publication and is updated daily on week days.
Initial download of the metrics may take a while.