Fig. 4.
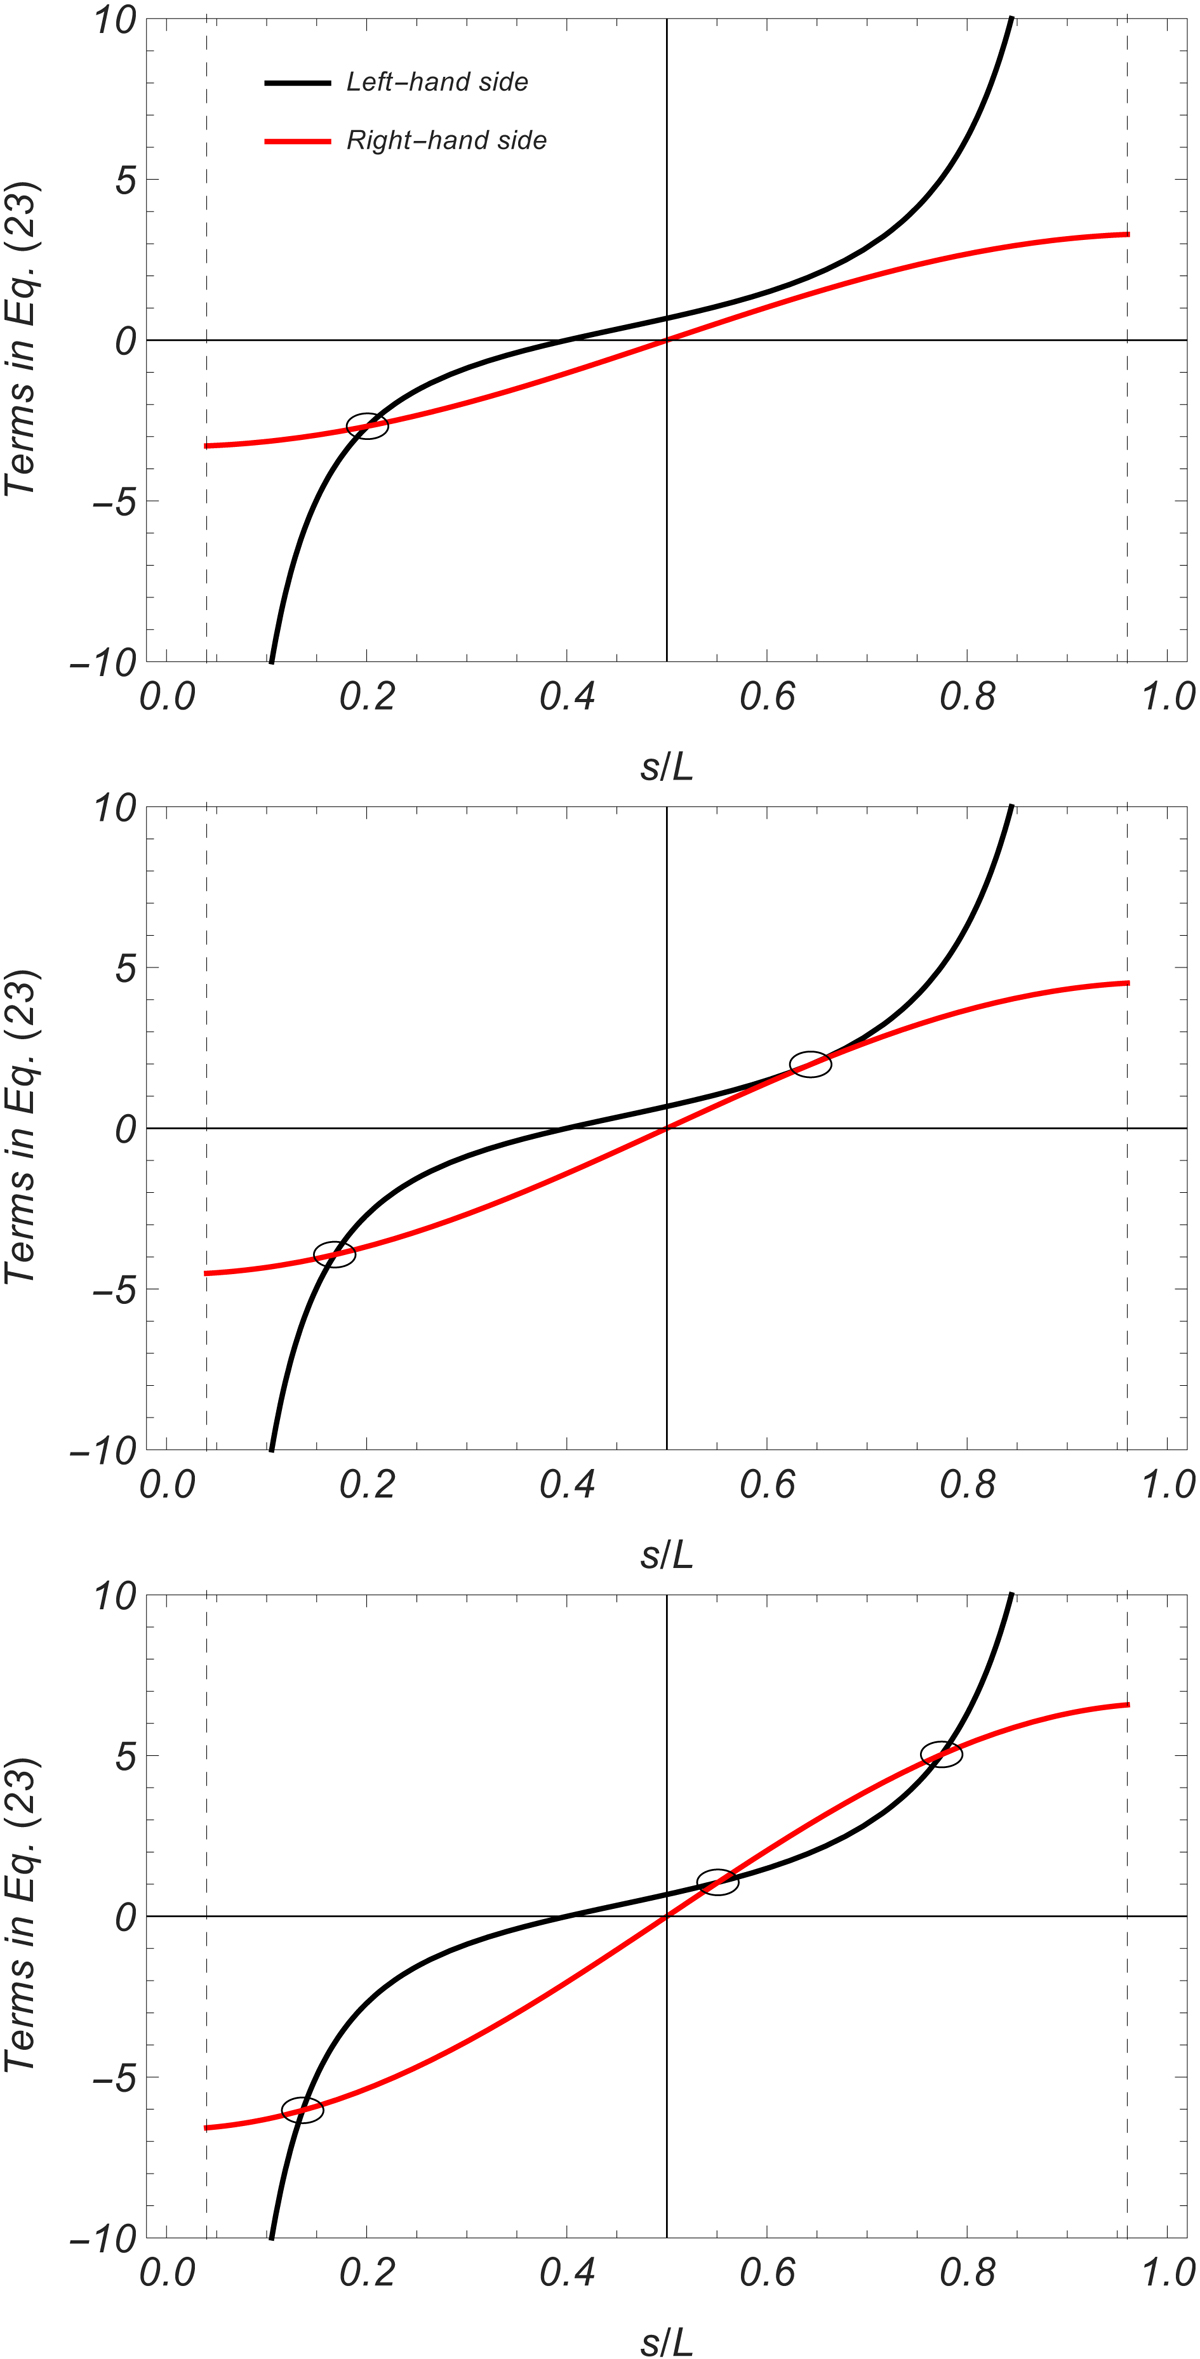
Left- (black line) and right- (red line) hand sides of Eq. (23) as a function of s/L, for three different situations with one, two, and three solutions. In these plots s0 = 0.4/L (where the black line crosses zero), L = 10 H, lt = L/50; ρt/ρ0 = 100 (top panel), ρt/ρ0 = ρtb/ρ0 (middle panel), and ρt/ρ0 = 200 (bottom panel). The value ρtb/ρ0 ≈ 137.28 is obtained from Eqs. (23) and (24). The vertical dashed lines represent the edges of the domain of the variable s, namely s = lt/2 and s = L − lt/2.
Current usage metrics show cumulative count of Article Views (full-text article views including HTML views, PDF and ePub downloads, according to the available data) and Abstracts Views on Vision4Press platform.
Data correspond to usage on the plateform after 2015. The current usage metrics is available 48-96 hours after online publication and is updated daily on week days.
Initial download of the metrics may take a while.