Fig. 2.
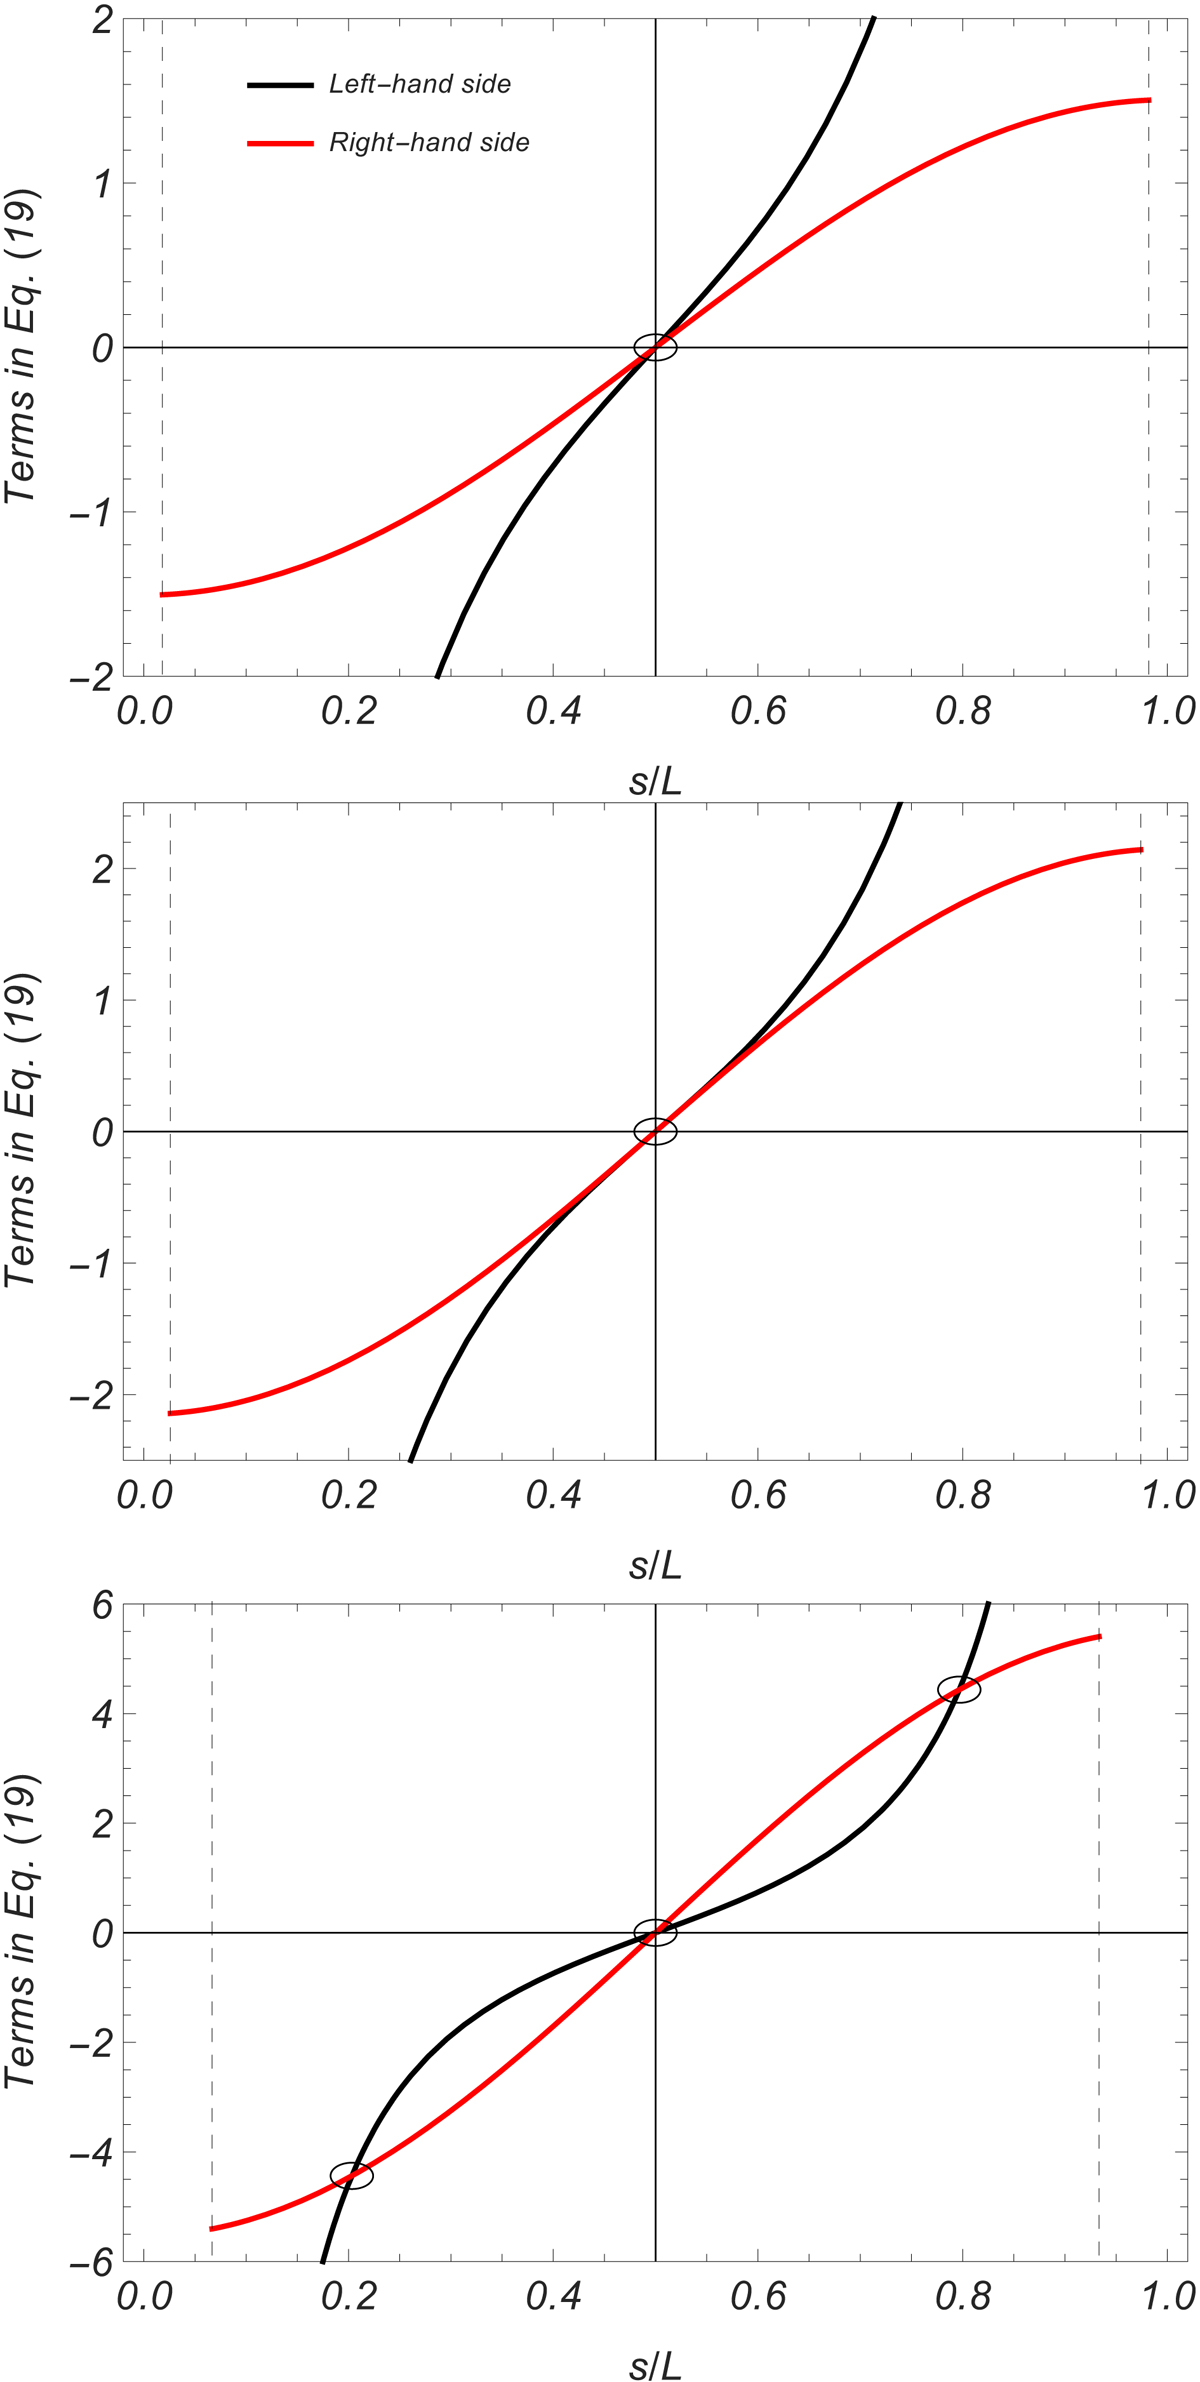
Left- (black line) and right- (red line) hand sides of Eq. (19) as a function of s/L, for three different values of lt. Top panel: system is linearly stable with one solution (see circle). Bottom panel: system relaxes to a new equilibrium at a lower height (see the two complementary solutions) and the trivial solution becomes an unstable solution. In all cases, L = 10 H and ρt = 100 ρ0; lt = L/110 (top panel), lt = ltb (middle panel), and lt = L/30 (bottom panel). The value ltb ≈ L/77.08 is obtained when the derivatives of the two curves at s = L/2 are the same (see Eq. (20)). The vertical dashed lines represent the edges of the domain of the variable s, namely s = lt/2 and s = L − lt/2.
Current usage metrics show cumulative count of Article Views (full-text article views including HTML views, PDF and ePub downloads, according to the available data) and Abstracts Views on Vision4Press platform.
Data correspond to usage on the plateform after 2015. The current usage metrics is available 48-96 hours after online publication and is updated daily on week days.
Initial download of the metrics may take a while.