Fig. 3.
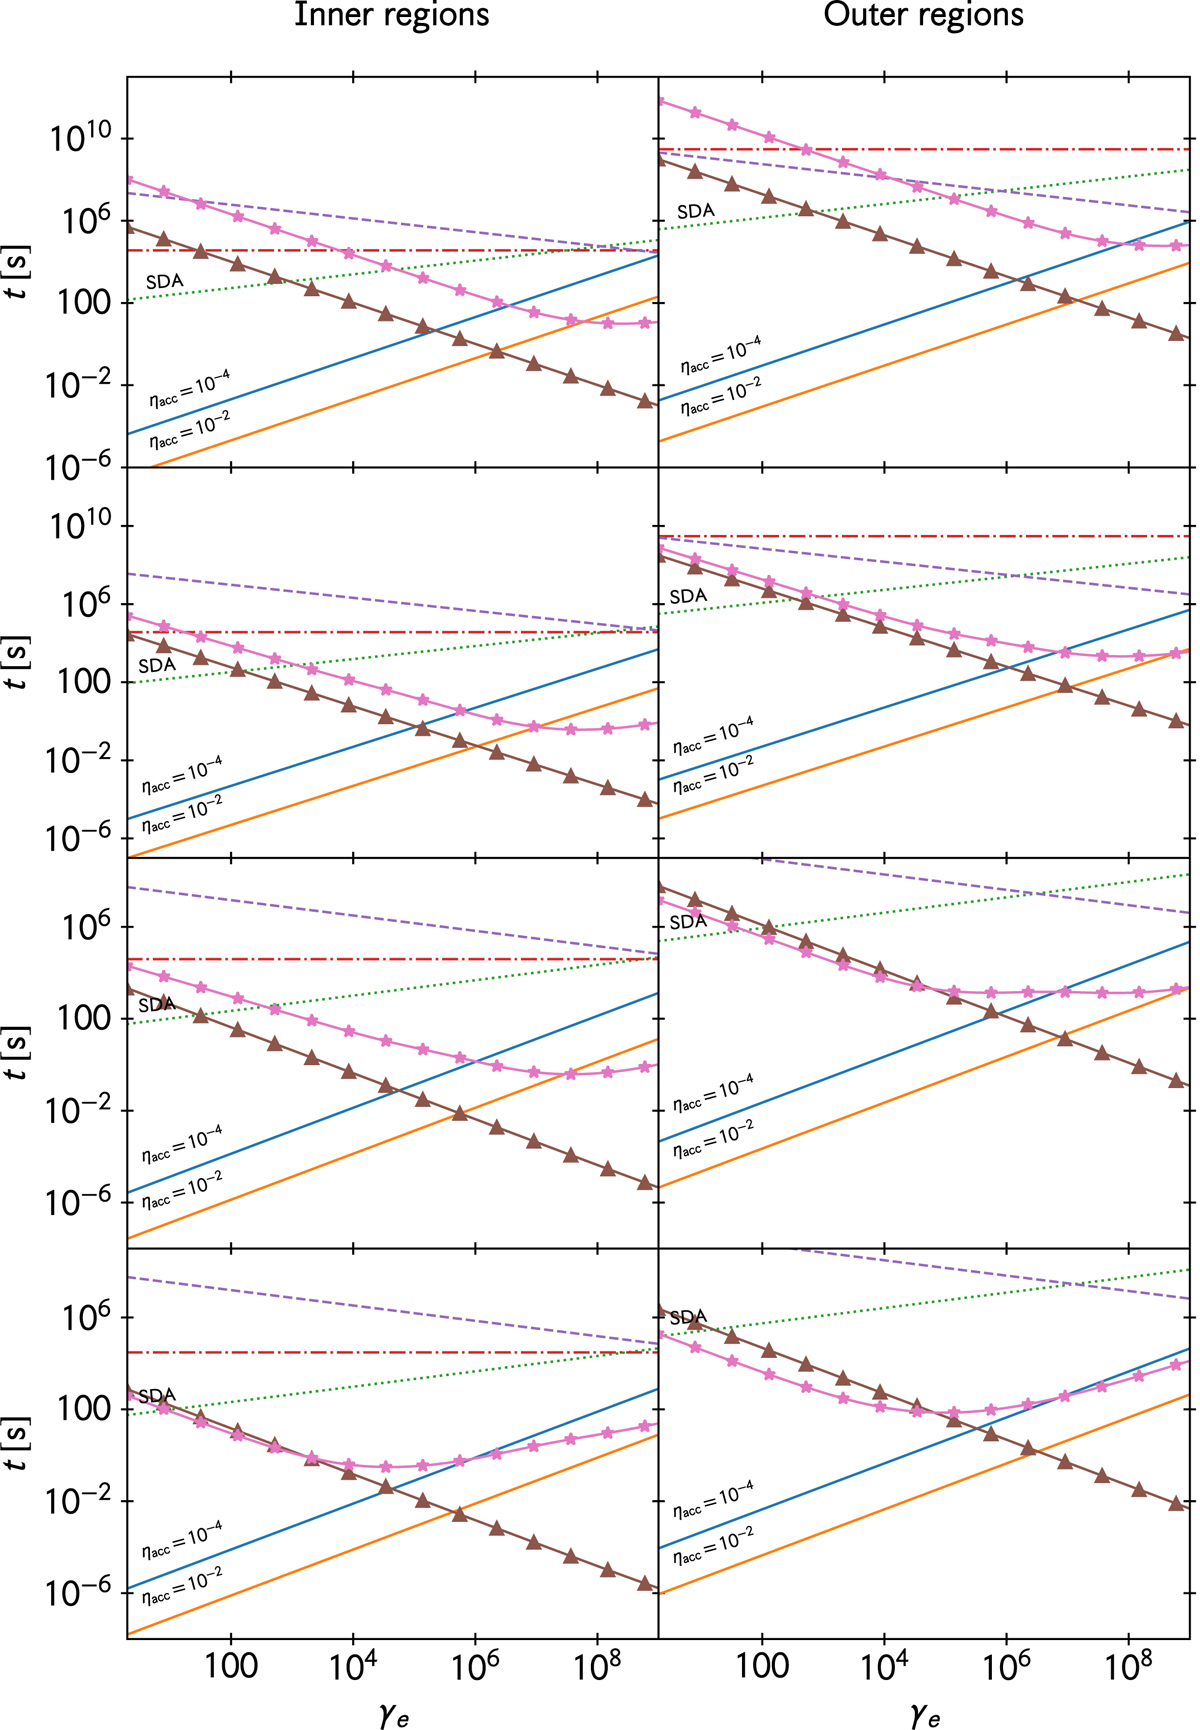
Timescales for nonthermal electrons in the various scenarios. Different rows show different scenarios (accretion rate increases downward), and each column shows different regions in the RIAF; left column: inner regions (∼5RS), right column: outer regions (∼200RS). Plain solid lines show acceleration timescales, where a proper flag indicates the value of the acceleration efficiency ηacc; dotted lines shows acceleration timescales for SDA (see Sect. 3.1). Dashed lines show the diffusion timescale, dash-dotted lines show the advection timescale. Solid lines with markers show cooling timescales for the relevant processes; with triangles: synchrotron, with stars: inverse Compton.
Current usage metrics show cumulative count of Article Views (full-text article views including HTML views, PDF and ePub downloads, according to the available data) and Abstracts Views on Vision4Press platform.
Data correspond to usage on the plateform after 2015. The current usage metrics is available 48-96 hours after online publication and is updated daily on week days.
Initial download of the metrics may take a while.