Fig. 7
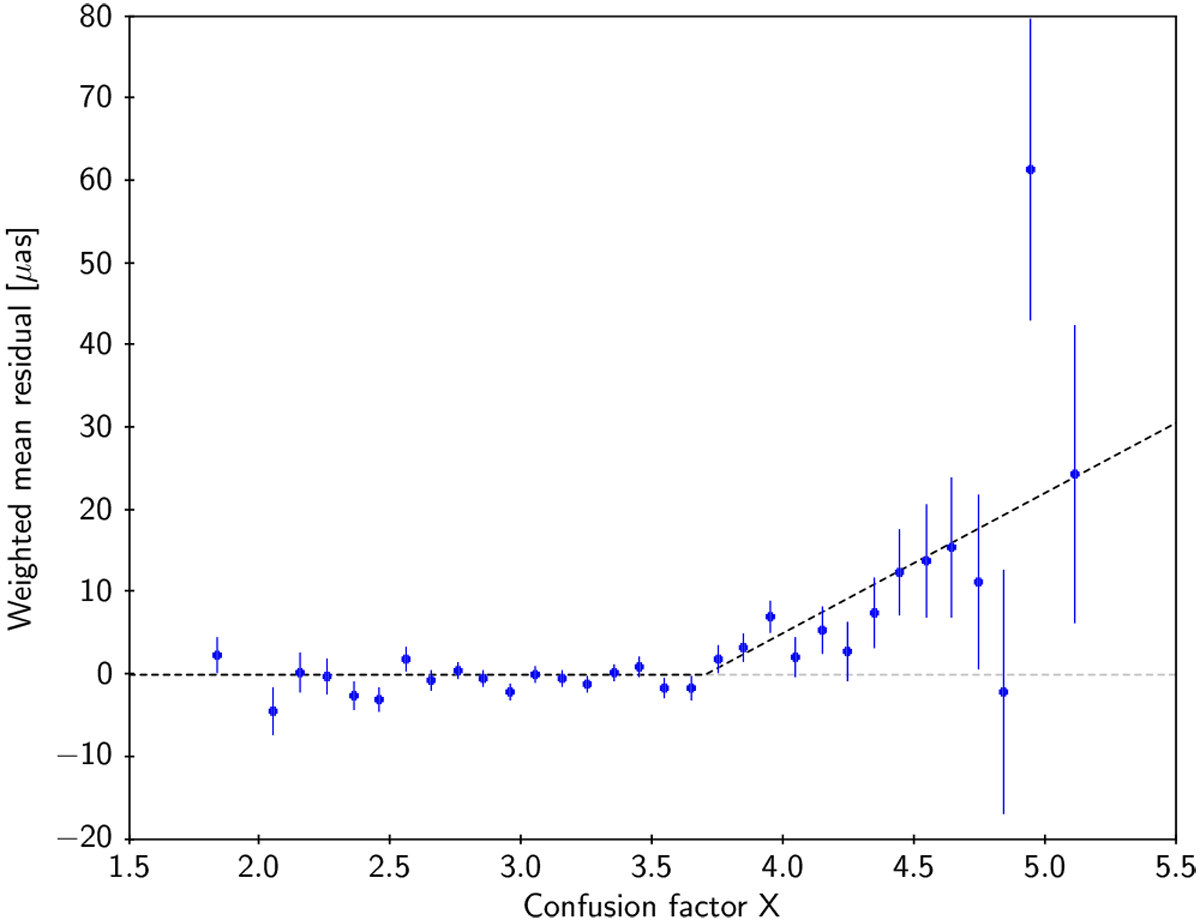
Mean residual in quasar parallax after a regression on G, νeff, and β (see text), plotted against the confusion factor from Eq. (6). In each bin the dot is the mean residual weighted by ![]() , with error bars indicating the estimated standard deviation of the weighted mean. The broken dashed line is the dependence modelled by Eq. (7).
, with error bars indicating the estimated standard deviation of the weighted mean. The broken dashed line is the dependence modelled by Eq. (7).
Current usage metrics show cumulative count of Article Views (full-text article views including HTML views, PDF and ePub downloads, according to the available data) and Abstracts Views on Vision4Press platform.
Data correspond to usage on the plateform after 2015. The current usage metrics is available 48-96 hours after online publication and is updated daily on week days.
Initial download of the metrics may take a while.