Fig. 5
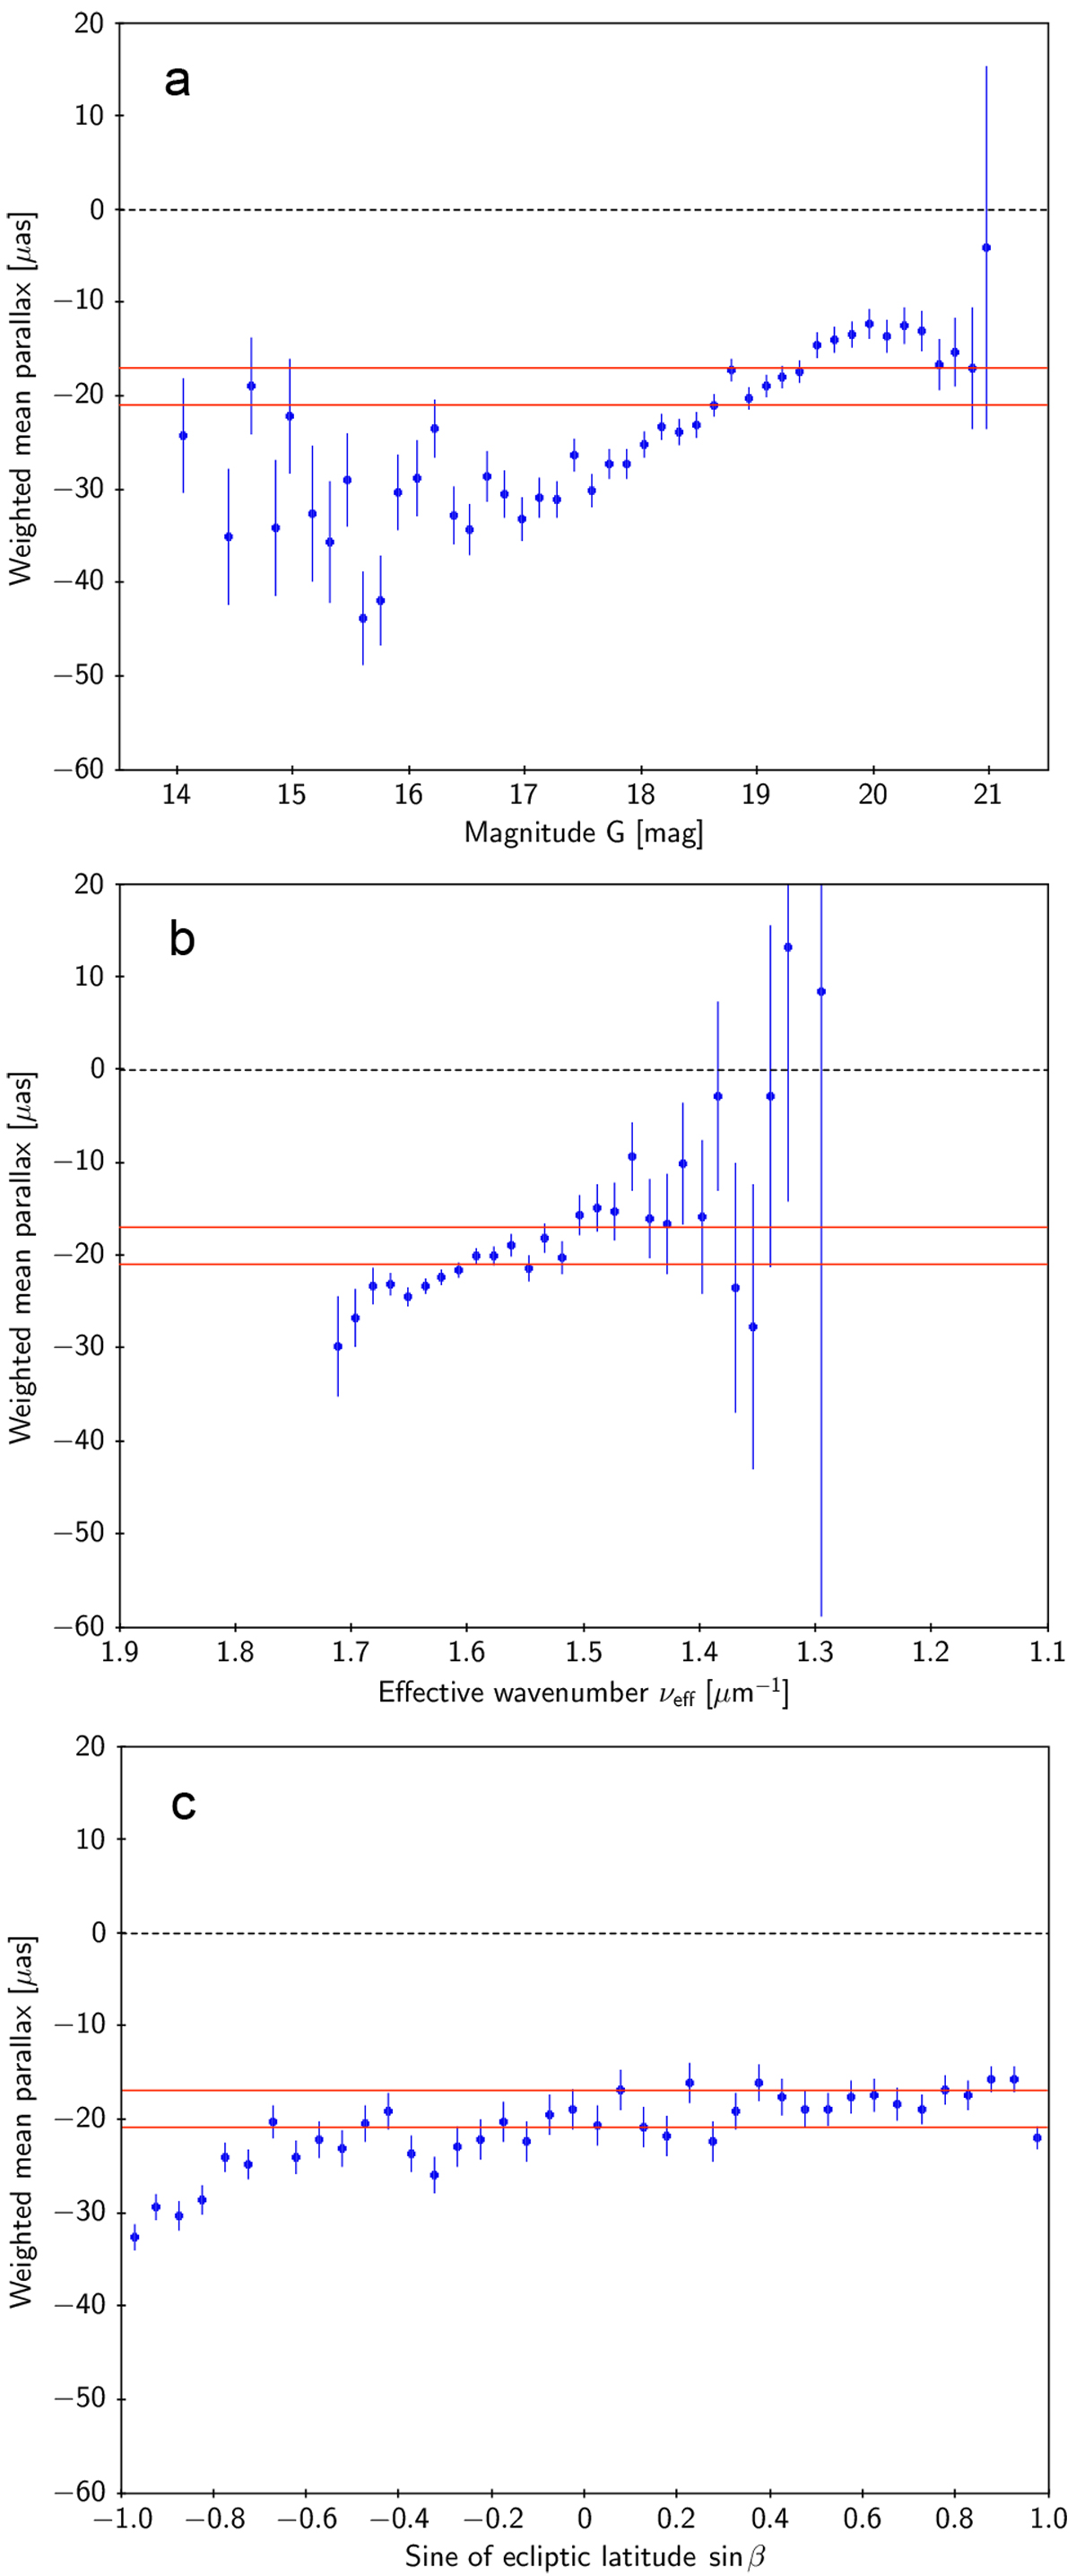
Mean parallax of quasars binned by magnitude (panel a), effective wavenumber (panel b), and sine of ecliptic latitude (panel c). In each bin the dot is the mean parallax in EDR3 weighted by ![]() , with error bars indicating the estimated standard deviation of the weighted mean. The two red lines indicate the weighted mean value (− 21 μas) and median (− 17 μas) of the full sample.
, with error bars indicating the estimated standard deviation of the weighted mean. The two red lines indicate the weighted mean value (− 21 μas) and median (− 17 μas) of the full sample.
Current usage metrics show cumulative count of Article Views (full-text article views including HTML views, PDF and ePub downloads, according to the available data) and Abstracts Views on Vision4Press platform.
Data correspond to usage on the plateform after 2015. The current usage metrics is available 48-96 hours after online publication and is updated daily on week days.
Initial download of the metrics may take a while.