Fig. D.2
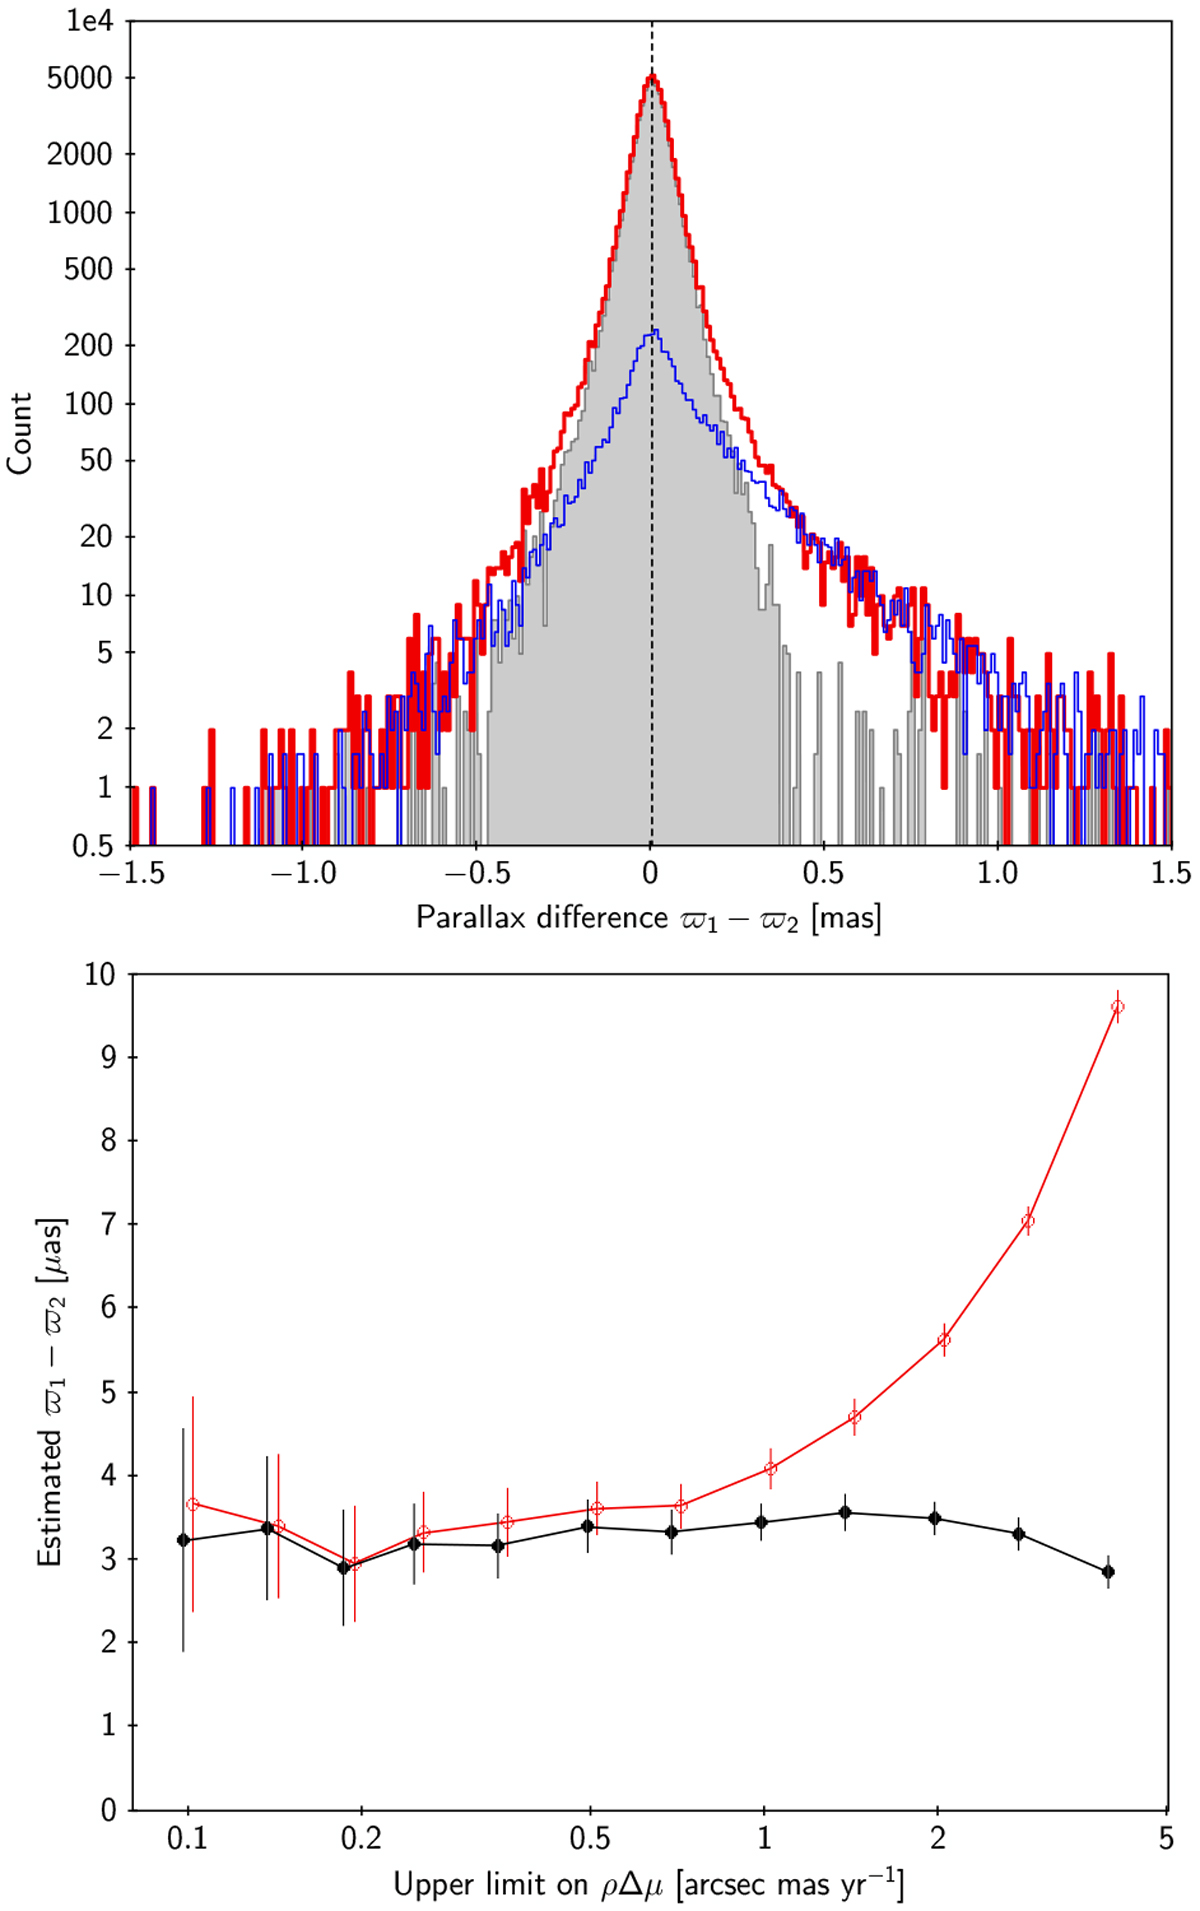
Illustrating the procedure for contamination bias correction. Top: distribution of parallax differences in sample A (thick red histogram) and for the mean of comparison samples B1 and B2 (thin blue histogram). The shaded grey histogram is the difference between the red and blue histograms. The dashed line is the corrected estimate of the parallax difference, equal to the median of the difference histogram. Bottom: uncorrected(open red circles) and corrected (filled black) estimates of the mean parallax difference vs. the cut in ρΔμ. For better visibility, the points have been slightly displaced sideways.
Current usage metrics show cumulative count of Article Views (full-text article views including HTML views, PDF and ePub downloads, according to the available data) and Abstracts Views on Vision4Press platform.
Data correspond to usage on the plateform after 2015. The current usage metrics is available 48-96 hours after online publication and is updated daily on week days.
Initial download of the metrics may take a while.