Fig. D.1
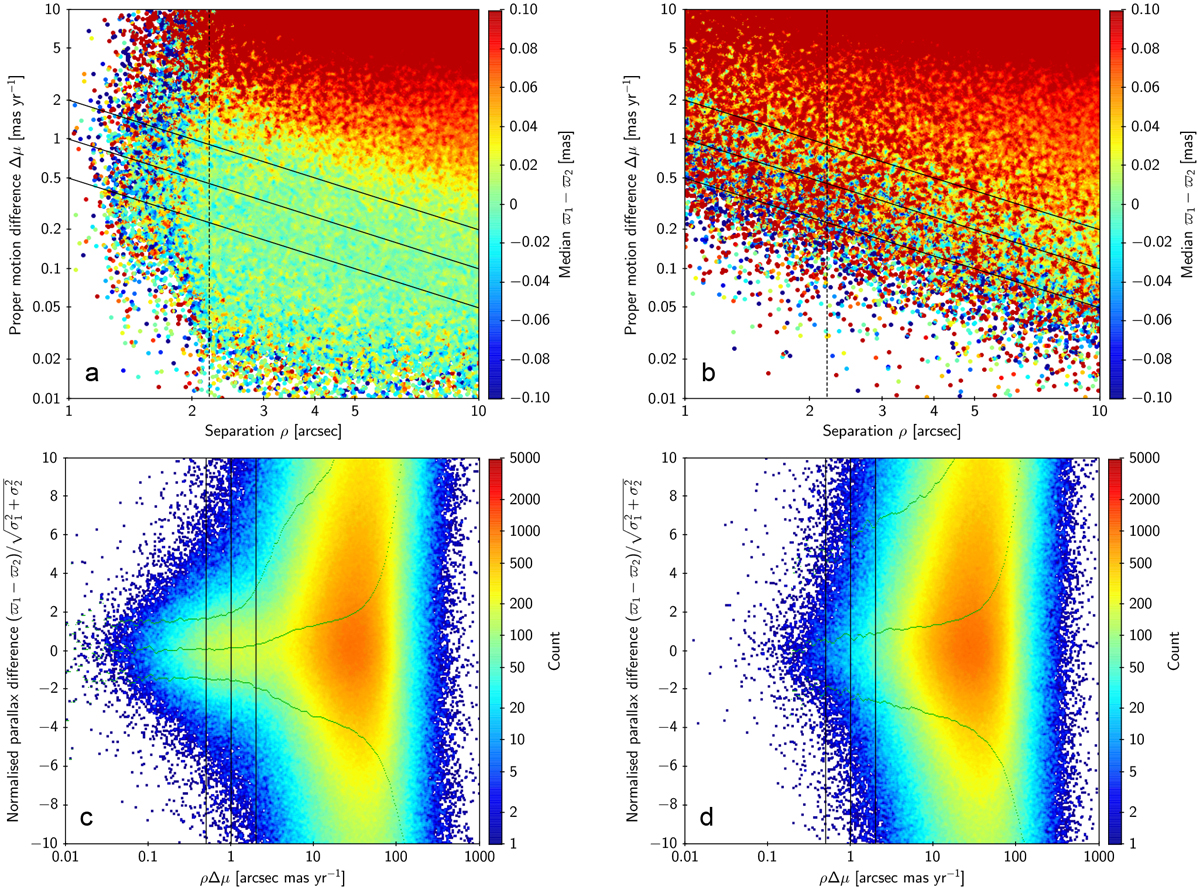
Illustration of the selection of physical pairs and the contamination by optical pairs. Top panels: proper motion difference (Δμ) vs. separation (ρ) for source pairs in sample A (a) and B1 (b) before making the cut ρ > 2.2 arcsec indicated by the dashed vertical line. The three solid lines correspond to ρΔμ = 0.5, 1, and 2 arcsec mas yr−1. The points are colour-coded by the median parallax difference between the components. In panel b the separation of the faint source is measured from the position of the bright source displaced by + 0.1° in declination. Bottom panels: normalised parallax difference vs. ρΔμ for the samples in the top panels, but now after the selection ρ > 2.2 arcsec. The three vertical lines correspond to the values of ρΔμ indicated in the top panels. The thin green curves show the 16th, 50th, and 84th percentiles of the distribution in normalised parallax difference.
Current usage metrics show cumulative count of Article Views (full-text article views including HTML views, PDF and ePub downloads, according to the available data) and Abstracts Views on Vision4Press platform.
Data correspond to usage on the plateform after 2015. The current usage metrics is available 48-96 hours after online publication and is updated daily on week days.
Initial download of the metrics may take a while.