Fig. 3
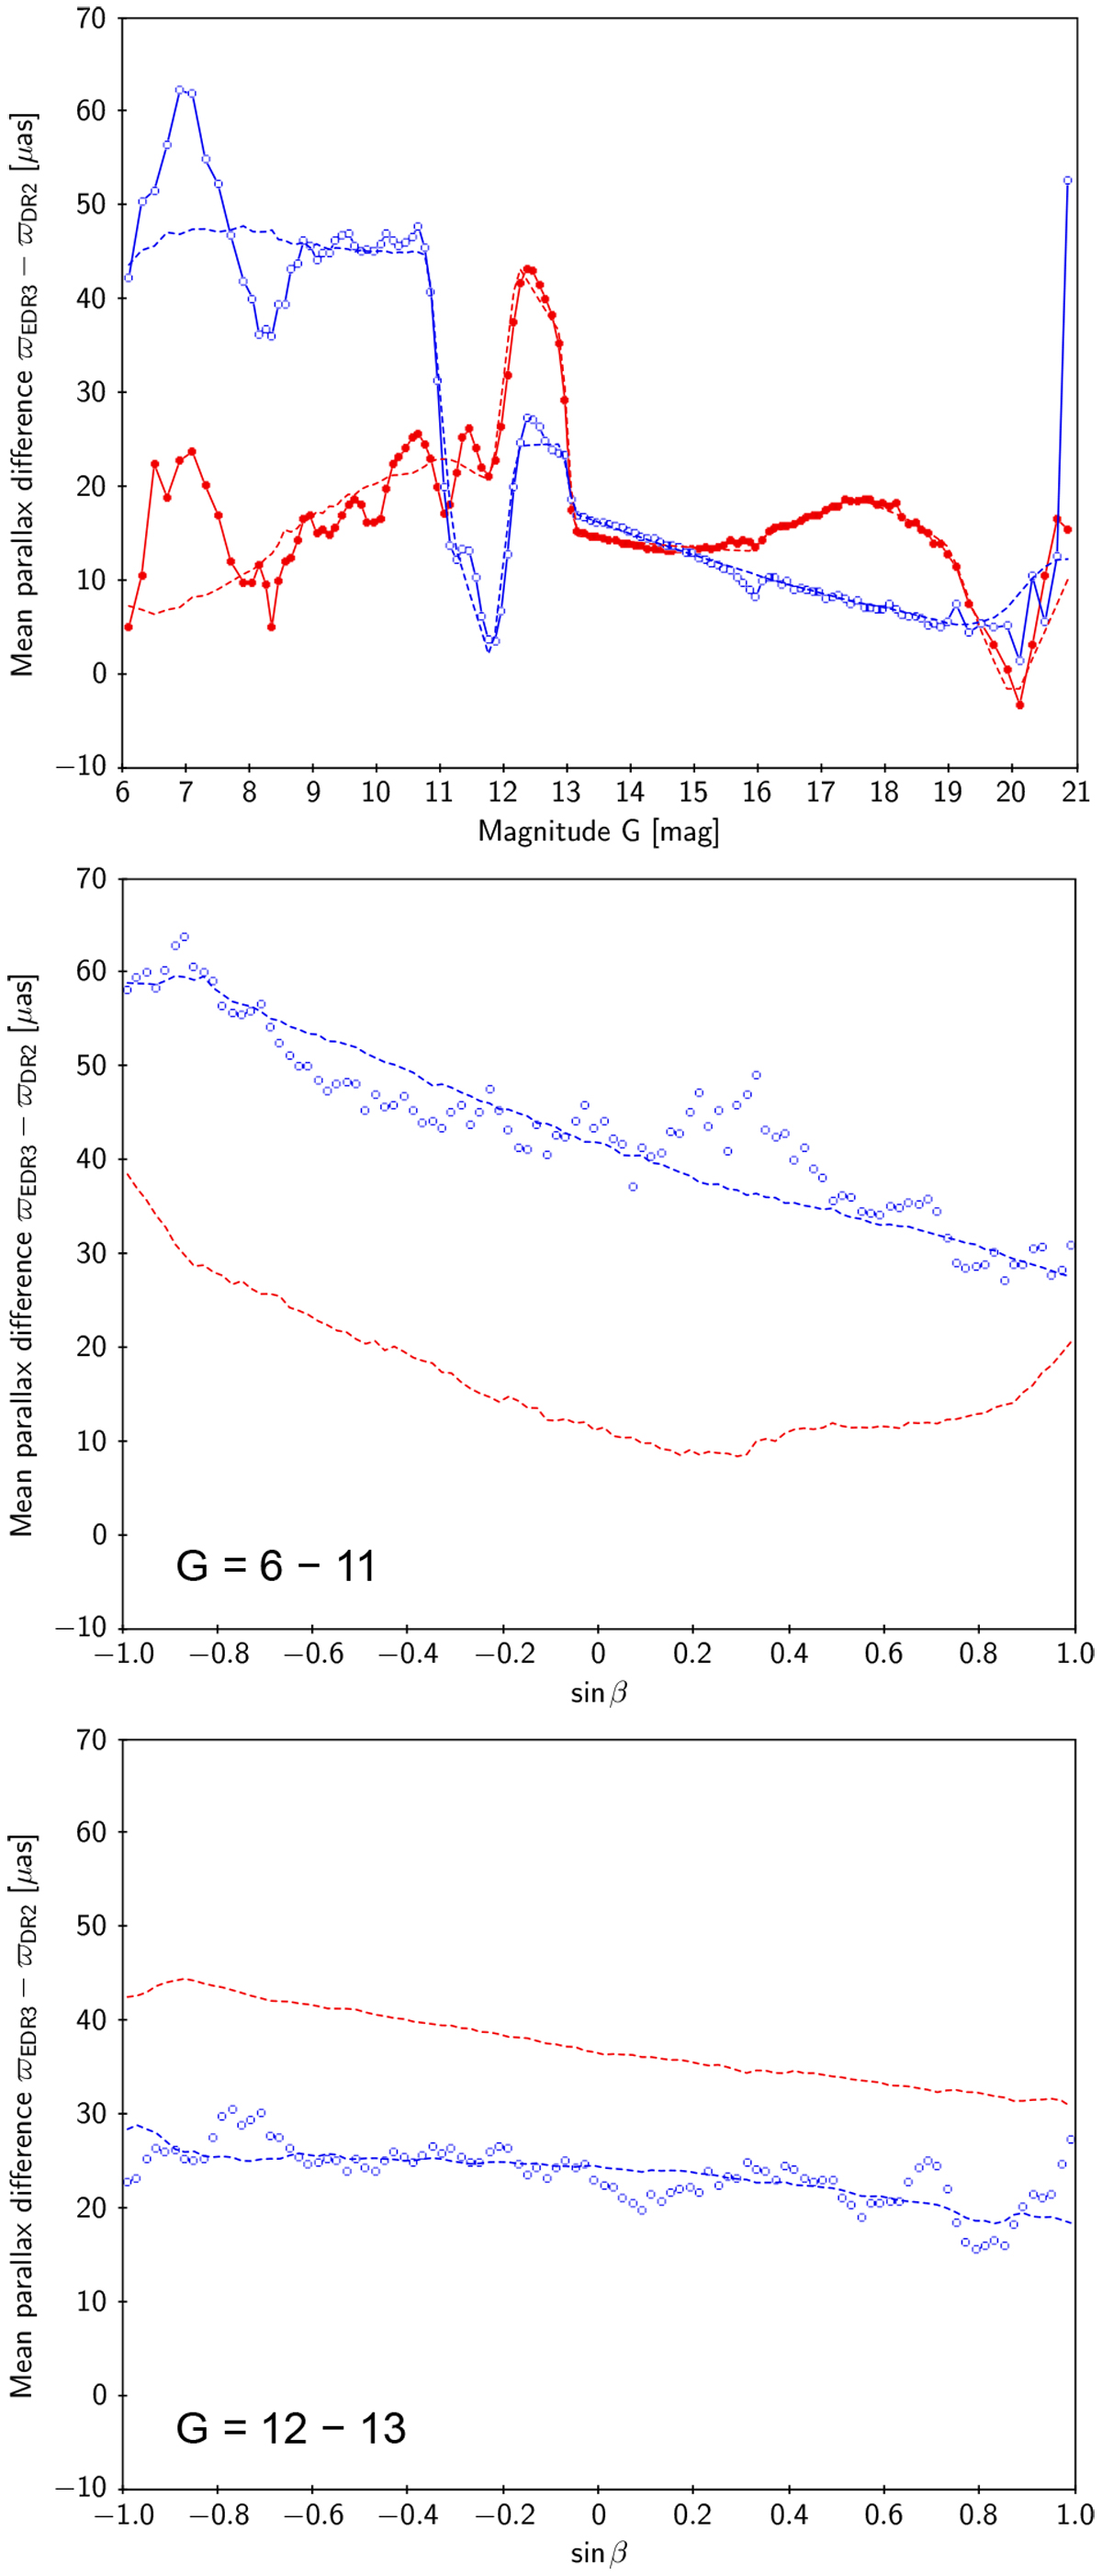
Mean difference in parallax between EDR3 and DR2. Top: parallax difference vs. magnitude. Middle and bottom: parallax difference vs. ecliptic latitude in two magnitude intervals. Circles connected by solid lines are weighted mean values computed in bins of variable size, with at least 1000 sources per bin; dashed lines are mean values of the fitted parametrised function ΔZ (Eq. (5)), binned as for the sources. Filled red circles are for νeff < 1.48 μm−1, and open blue circles for νeff > 1.48 μm−1.
Current usage metrics show cumulative count of Article Views (full-text article views including HTML views, PDF and ePub downloads, according to the available data) and Abstracts Views on Vision4Press platform.
Data correspond to usage on the plateform after 2015. The current usage metrics is available 48-96 hours after online publication and is updated daily on week days.
Initial download of the metrics may take a while.