Fig. C.3
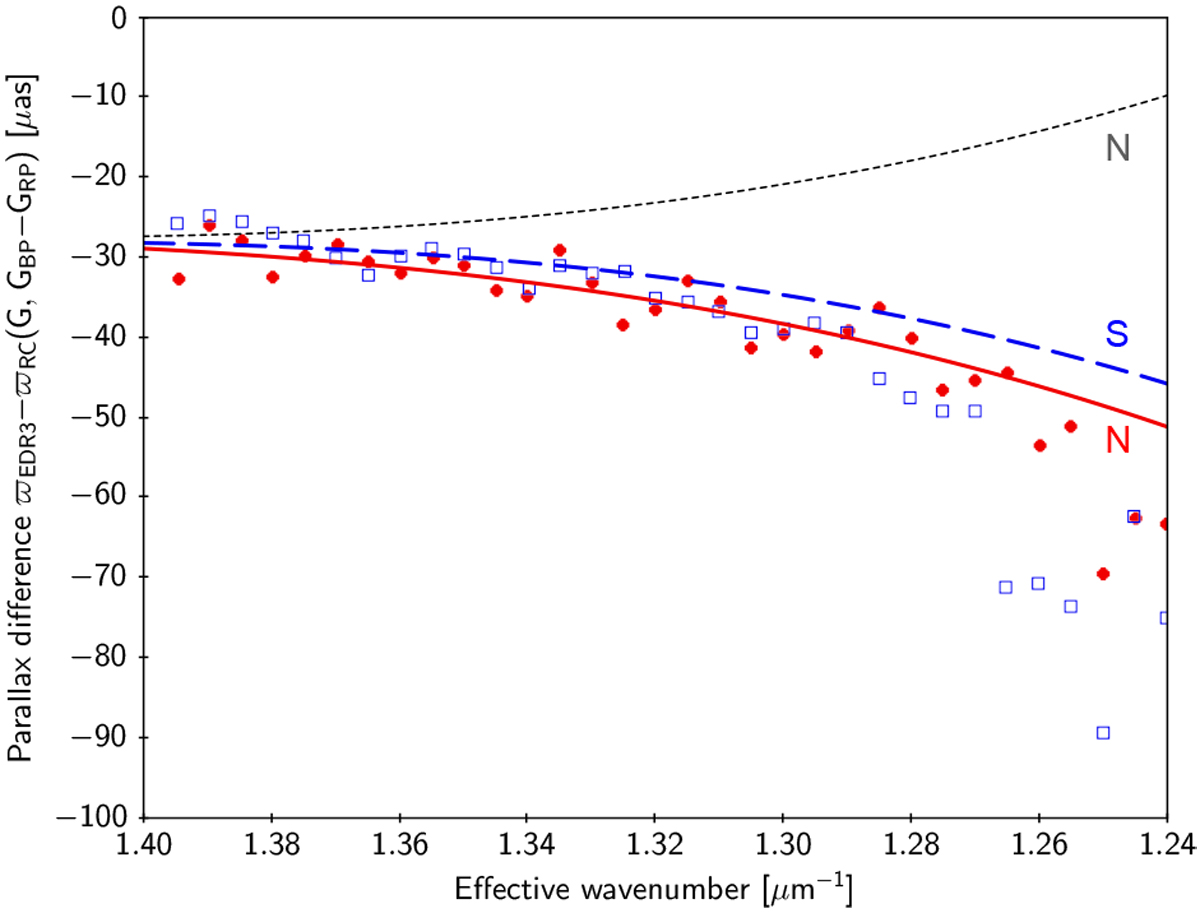
Differential parallax bias estimated by means of RC stars. The points show the locations of the ridges in Fig. C.2 for area N (filled red circles) and S (open blue squares). The curves show the expected locations at G = 17 according toTable 6 for area N (solid red) and S (long-dashed blue), assuming that the curvature with colour (j = 2) is the same in both areas. If the curvature had flipped sign with β, the ridge location for area N should instead follow the up-bending, short-dashed black curve.
Current usage metrics show cumulative count of Article Views (full-text article views including HTML views, PDF and ePub downloads, according to the available data) and Abstracts Views on Vision4Press platform.
Data correspond to usage on the plateform after 2015. The current usage metrics is available 48-96 hours after online publication and is updated daily on week days.
Initial download of the metrics may take a while.