Fig. C.2
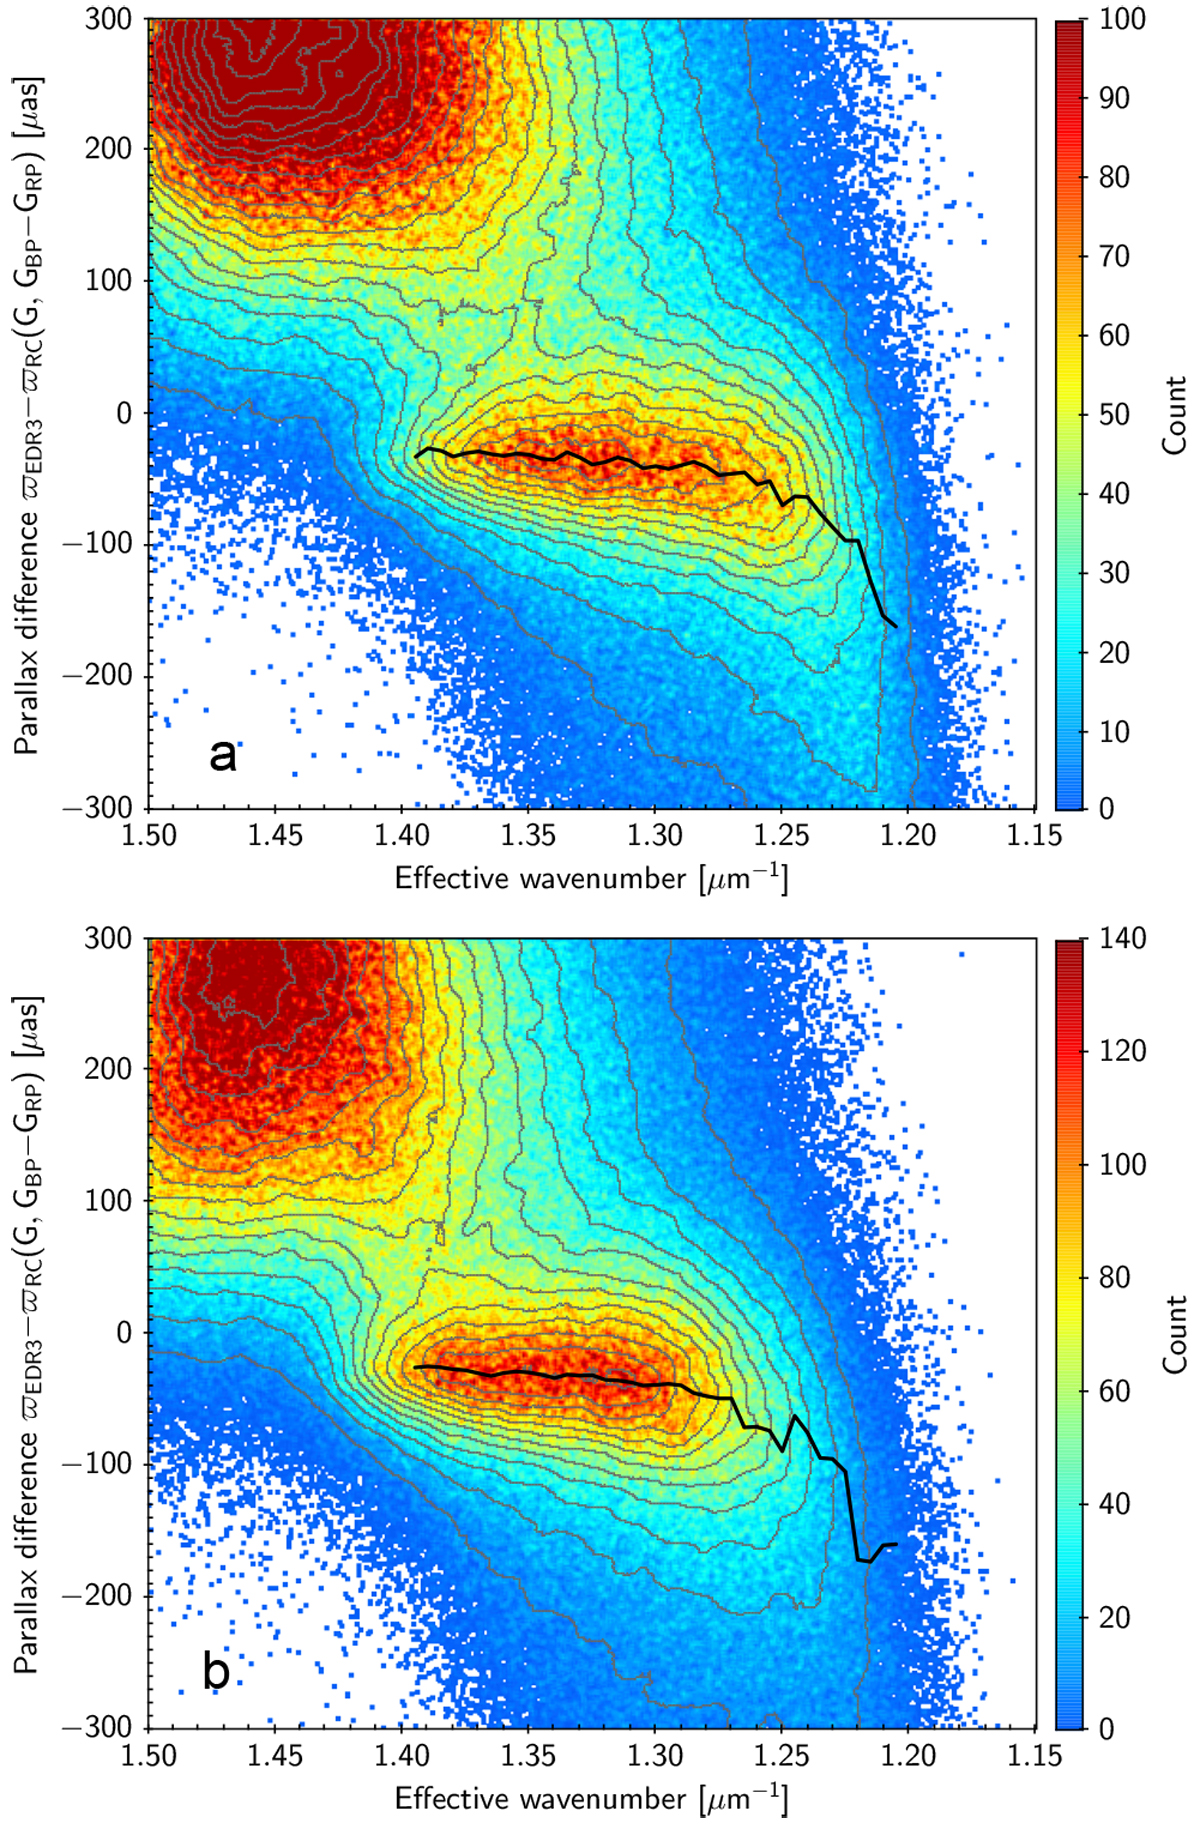
Differential parallax bias estimated by means of RC stars. The plots show differences between the measured parallaxes ϖEDR3 and the photometric parallaxes ϖRC from Eq. (C.2) in area N (a) and S (b). Contours of constant density are shown as thin grey lines. The thick black curve traces the ridge of the feature created by the red clump stars.
Current usage metrics show cumulative count of Article Views (full-text article views including HTML views, PDF and ePub downloads, according to the available data) and Abstracts Views on Vision4Press platform.
Data correspond to usage on the plateform after 2015. The current usage metrics is available 48-96 hours after online publication and is updated daily on week days.
Initial download of the metrics may take a while.