Fig. B.1
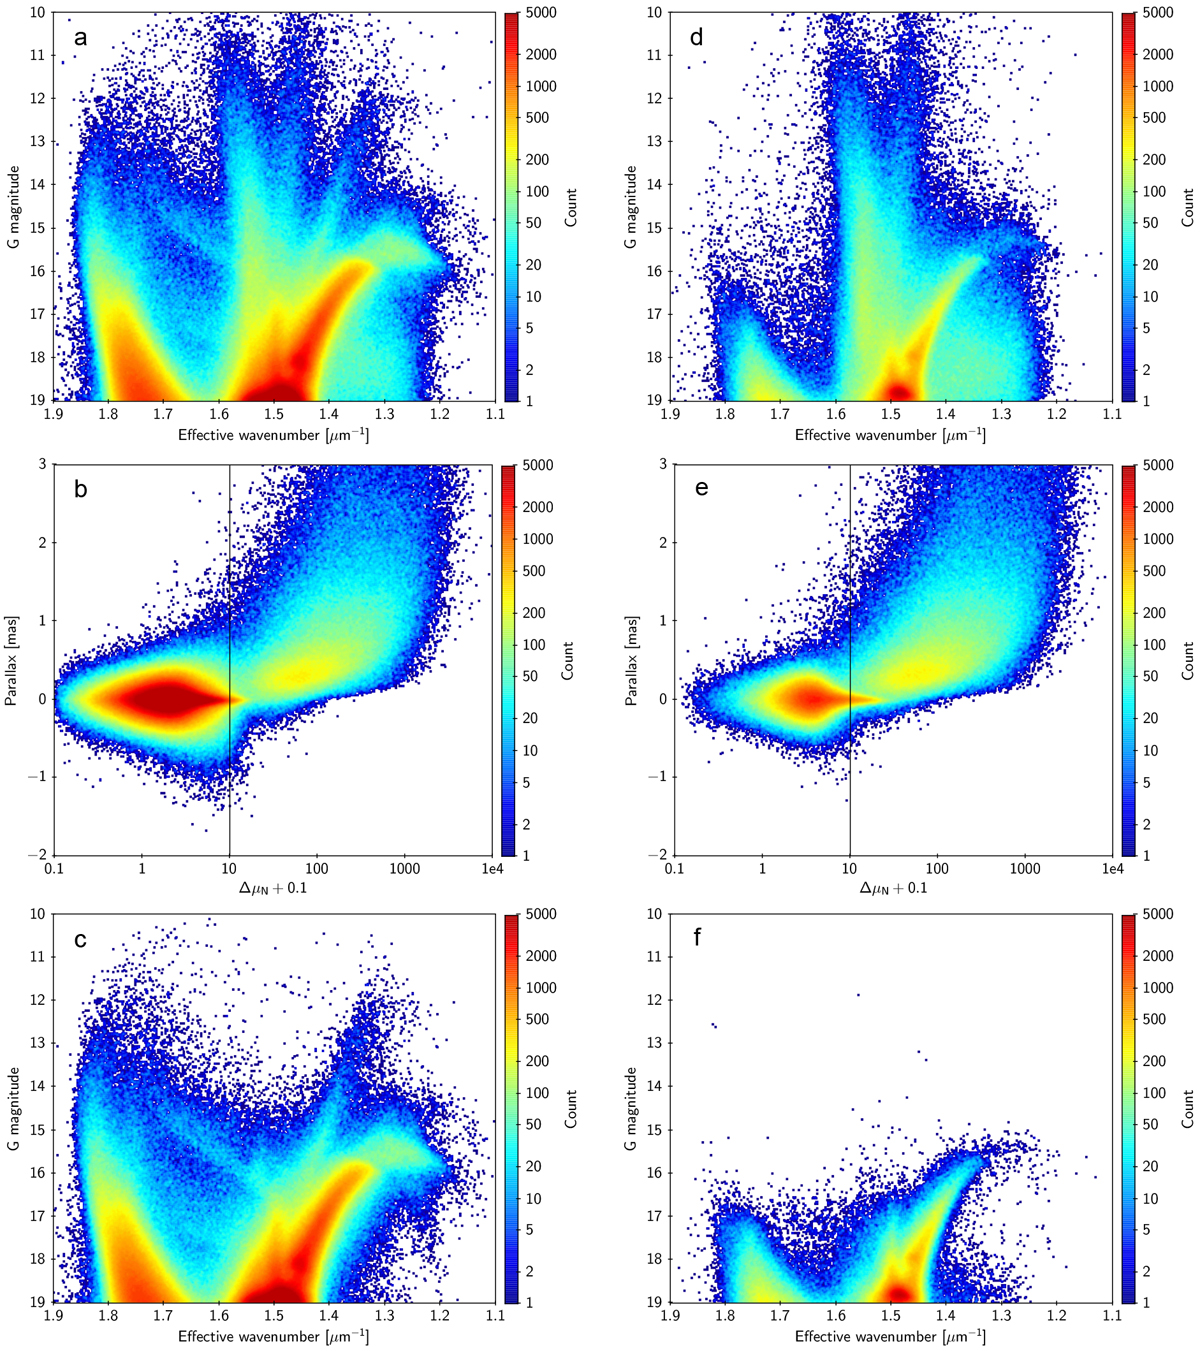
Illustrating the selection and validation of the LMC sample. (a) Colour-magnitude diagram for the original sample centred on (lC, bC). (b) Joint distribution for the original sample of parallax and ΔμN, the normalised proper-motion difference to the fitted model. The vertical line marks the cut-off used for the selection based on proper motions. (c) Colour-magnitude diagram for the sub-sample with ΔμN < 10. (d–f) Same as (a–c), but for a sample centred on (lC − 10°, bC), containing far fewer LMC stars, but roughly the same number of Galactic foreground stars as in (a–c).
Current usage metrics show cumulative count of Article Views (full-text article views including HTML views, PDF and ePub downloads, according to the available data) and Abstracts Views on Vision4Press platform.
Data correspond to usage on the plateform after 2015. The current usage metrics is available 48-96 hours after online publication and is updated daily on week days.
Initial download of the metrics may take a while.