Fig. 20
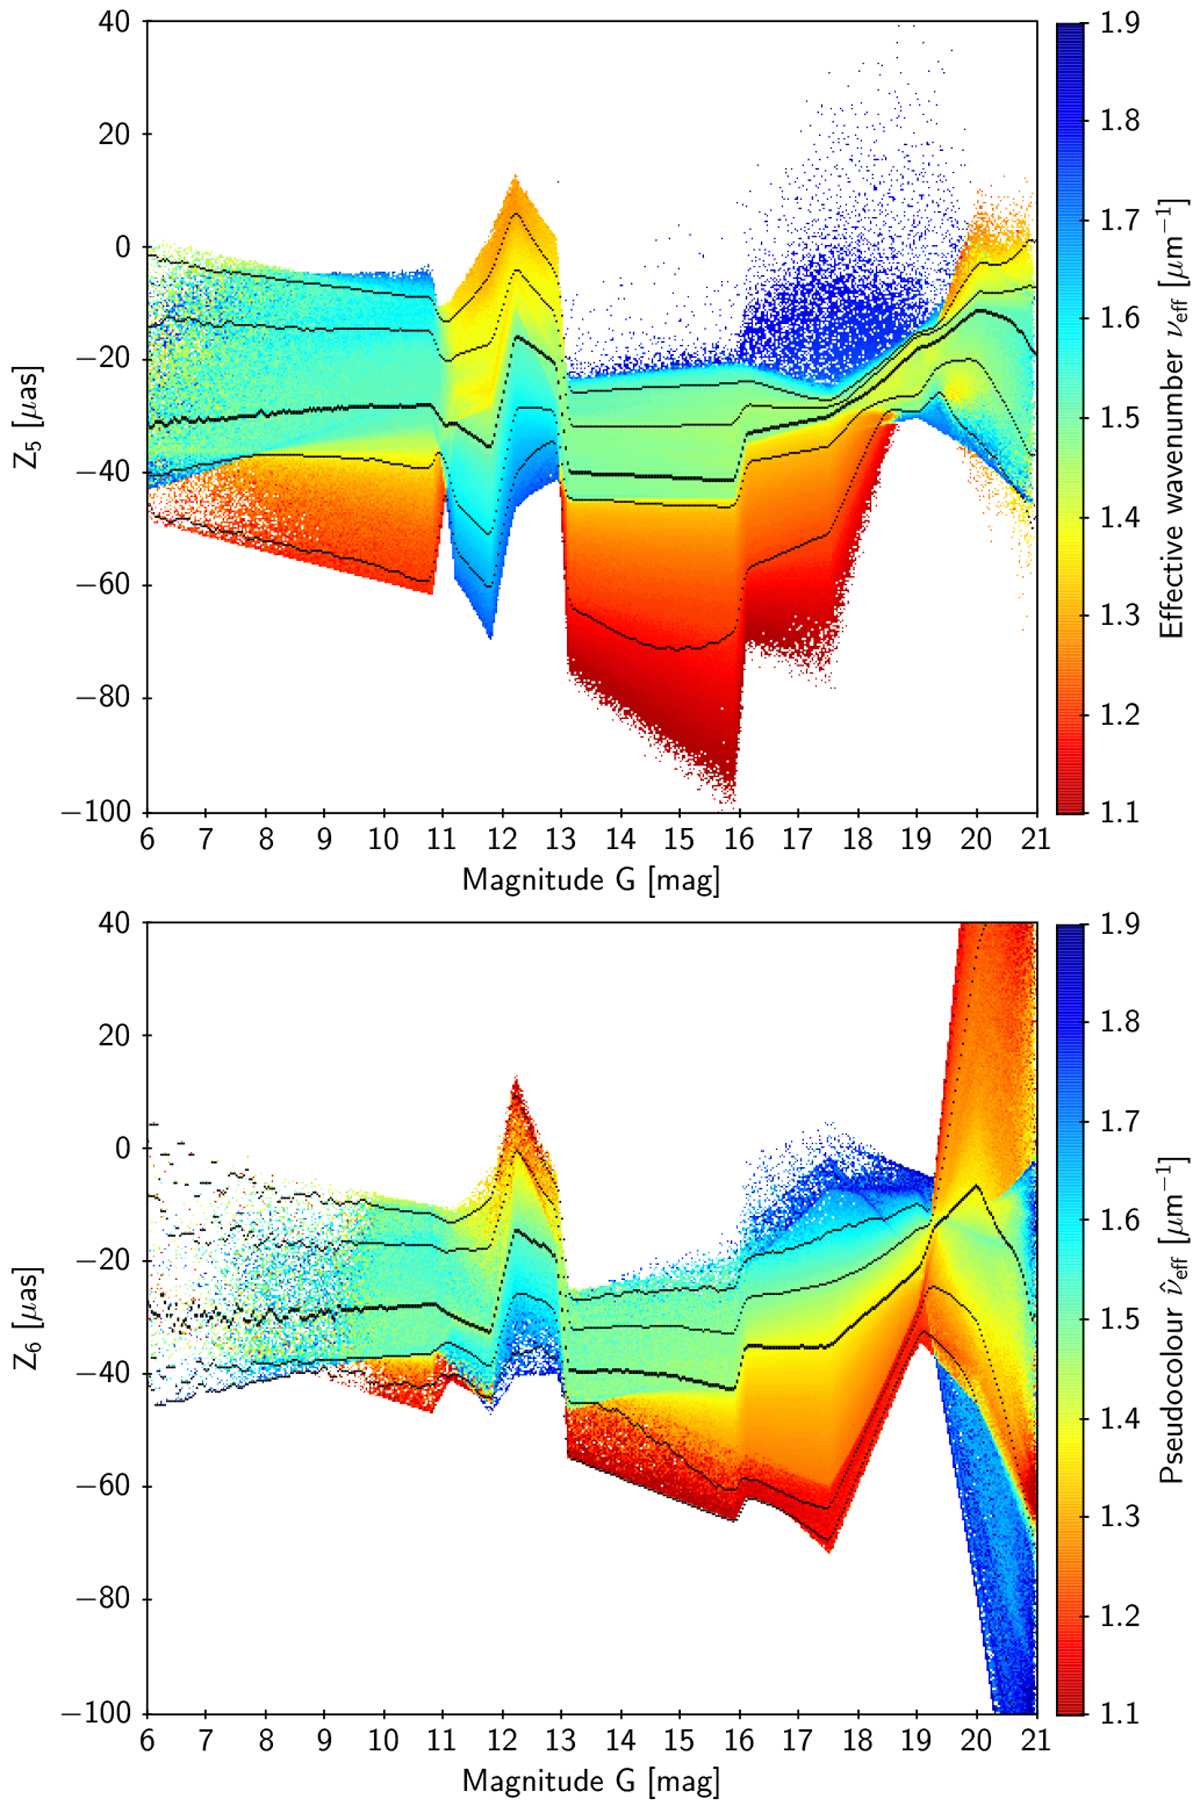
Parallax bias Z5 (top) and Z6 (bottom) computed according to Tables 9 and 10 for a representative sample of sources with five- and six-parameter solutions in EDR3. The dots show values for the complete sample of sources (for G < 11.5) or for a random selection (G > 11.5). The colour scale indicates the mean νeff or ![]() at a given point, thus giving an impression of the mean colour dependence of the bias. The black curves show the 1st, 10th, 50th, 90th, and 99th percentiles. The thick curve is the 50th percentile or median.
at a given point, thus giving an impression of the mean colour dependence of the bias. The black curves show the 1st, 10th, 50th, 90th, and 99th percentiles. The thick curve is the 50th percentile or median.
Current usage metrics show cumulative count of Article Views (full-text article views including HTML views, PDF and ePub downloads, according to the available data) and Abstracts Views on Vision4Press platform.
Data correspond to usage on the plateform after 2015. The current usage metrics is available 48-96 hours after online publication and is updated daily on week days.
Initial download of the metrics may take a while.