Fig. 17
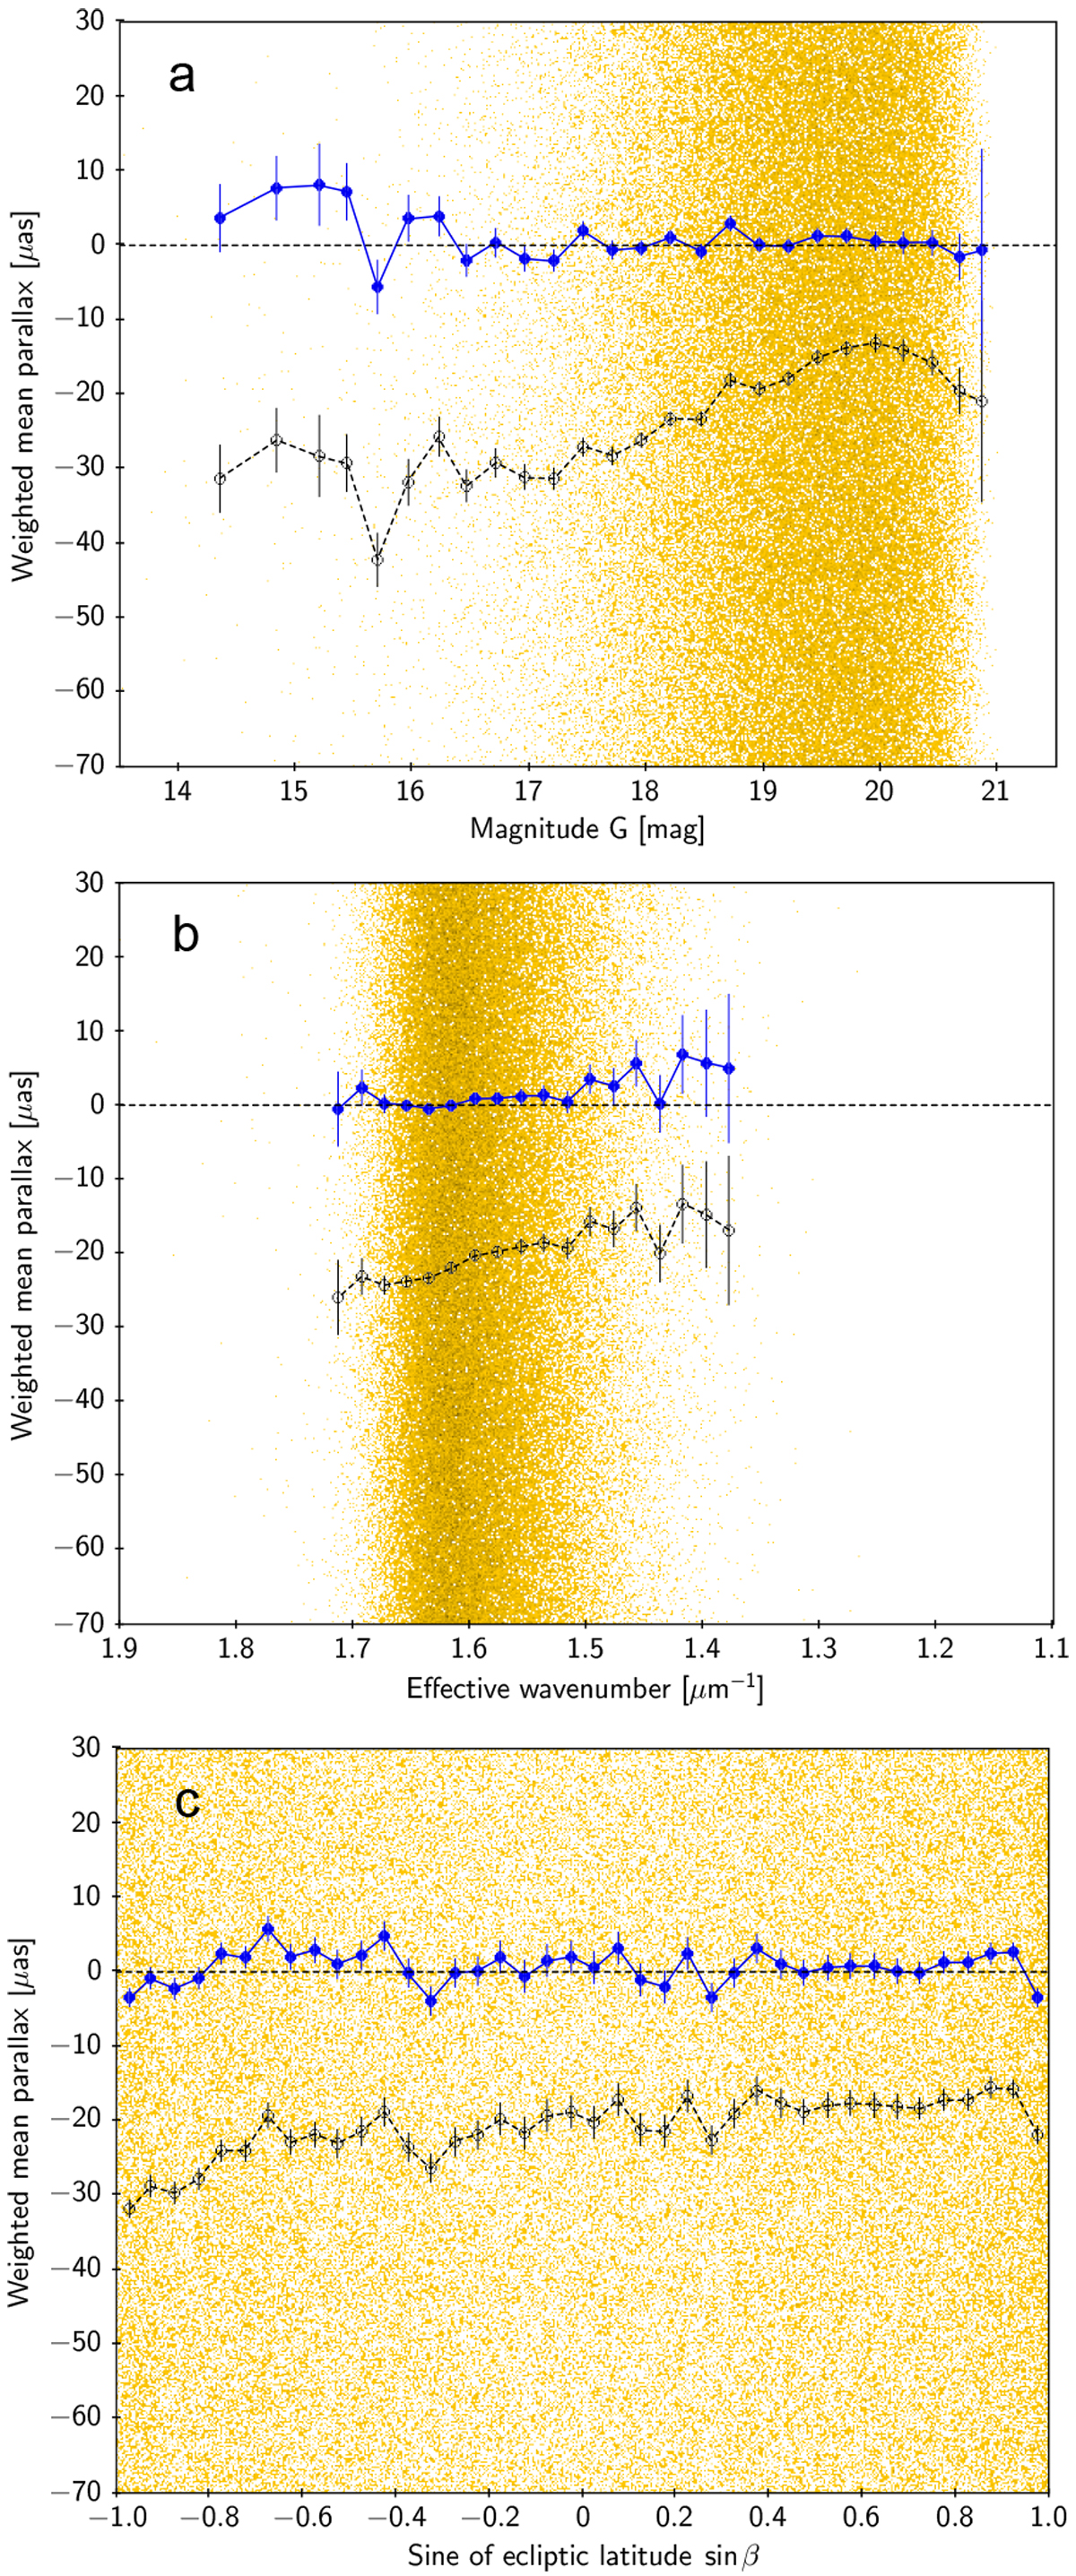
Parallaxes for 1.2 million quasars with five-parameter solutions in Gaia EDR3. Yellow dots show theindividual values plotted vs. magnitude (panel a), effective wavenumber (panel b), and sine of ecliptic latitude (panel c). Open black circles show mean values of the uncorrected parallaxes (ϖ) in bins of magnitude etc., and filled blue circles show mean values of the corrected parallaxes (ϖ − Z5) in the same bins. Mean values are calculated using weights ![]() . Error bars indicate the estimated standard deviation of the weighted mean in each bin.
. Error bars indicate the estimated standard deviation of the weighted mean in each bin.
Current usage metrics show cumulative count of Article Views (full-text article views including HTML views, PDF and ePub downloads, according to the available data) and Abstracts Views on Vision4Press platform.
Data correspond to usage on the plateform after 2015. The current usage metrics is available 48-96 hours after online publication and is updated daily on week days.
Initial download of the metrics may take a while.