Fig. 11
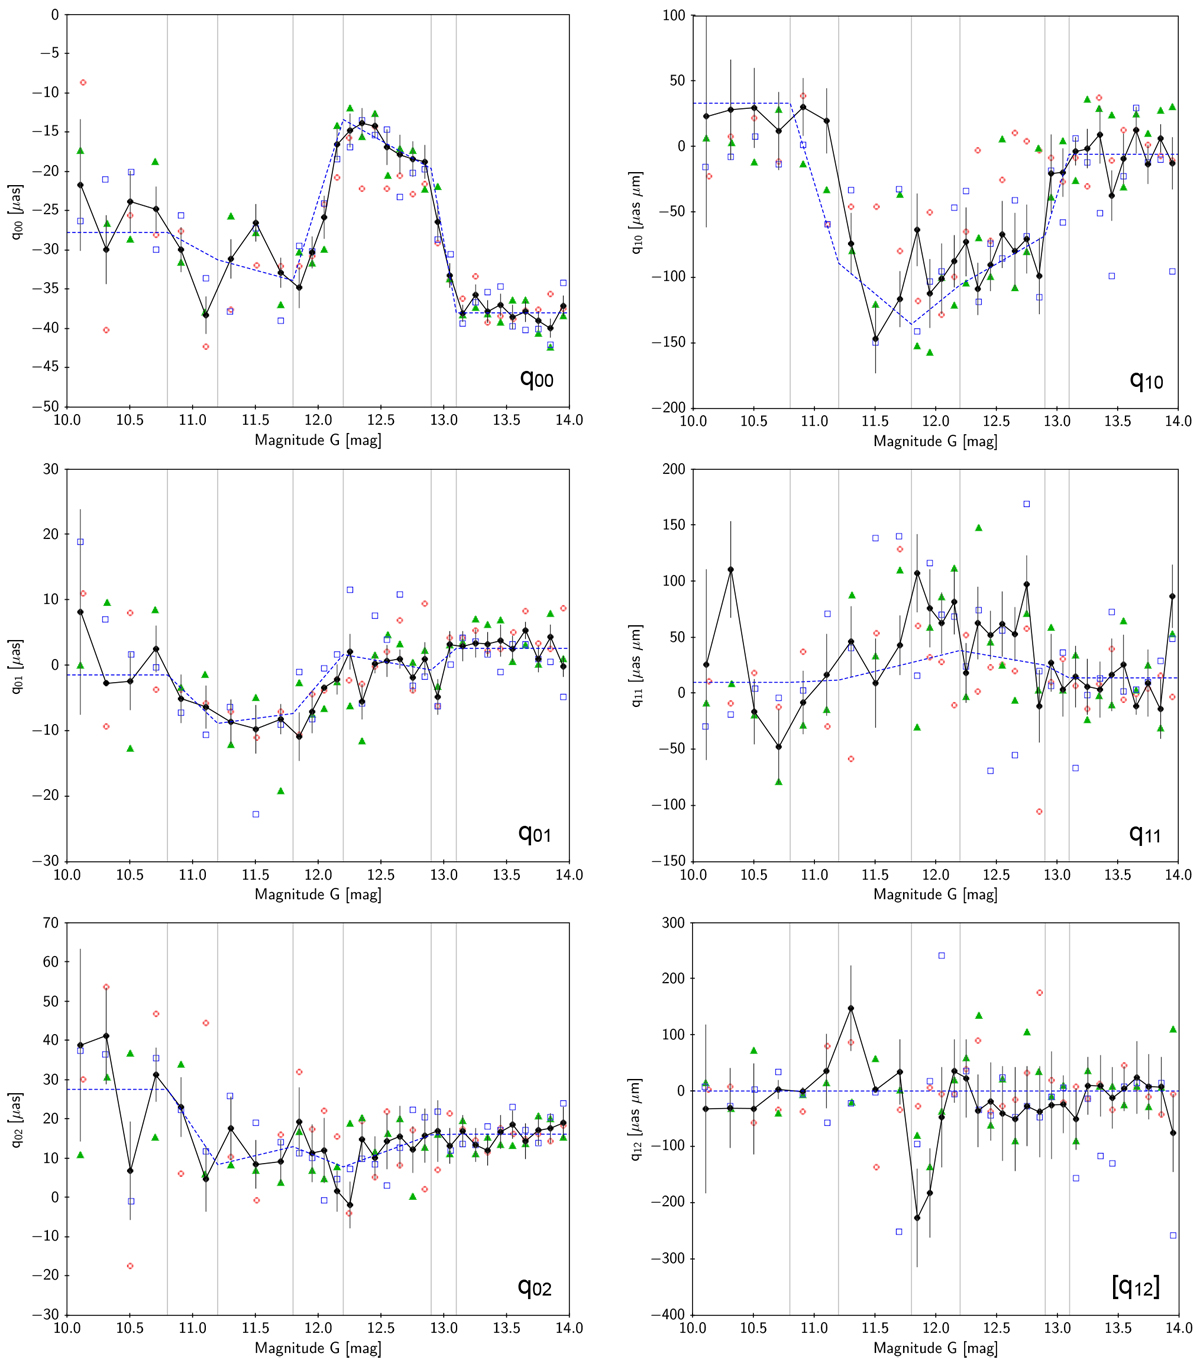
Coefficients qjk estimated from physical pairs as functions of G. Results for q12 are considered insignificant and set to zero when fitting the other five coefficients. The different symbols represent different selections onρΔμ: 0–0.5 arcsec mas yr−1 (red circles), 0.5–1 arcsec mas yr−1 (green triangles), 1–2 arcsec mas yr−1 (blue squares), and 0–2 arcsec mas yr−1 (filled black circles with lines and error bars). The dashed blue line is the global fit in Table 7. The vertical grey lines show the breakpoints for the basis functions in G defined by Eq. (A.2).
Current usage metrics show cumulative count of Article Views (full-text article views including HTML views, PDF and ePub downloads, according to the available data) and Abstracts Views on Vision4Press platform.
Data correspond to usage on the plateform after 2015. The current usage metrics is available 48-96 hours after online publication and is updated daily on week days.
Initial download of the metrics may take a while.