Fig. 10
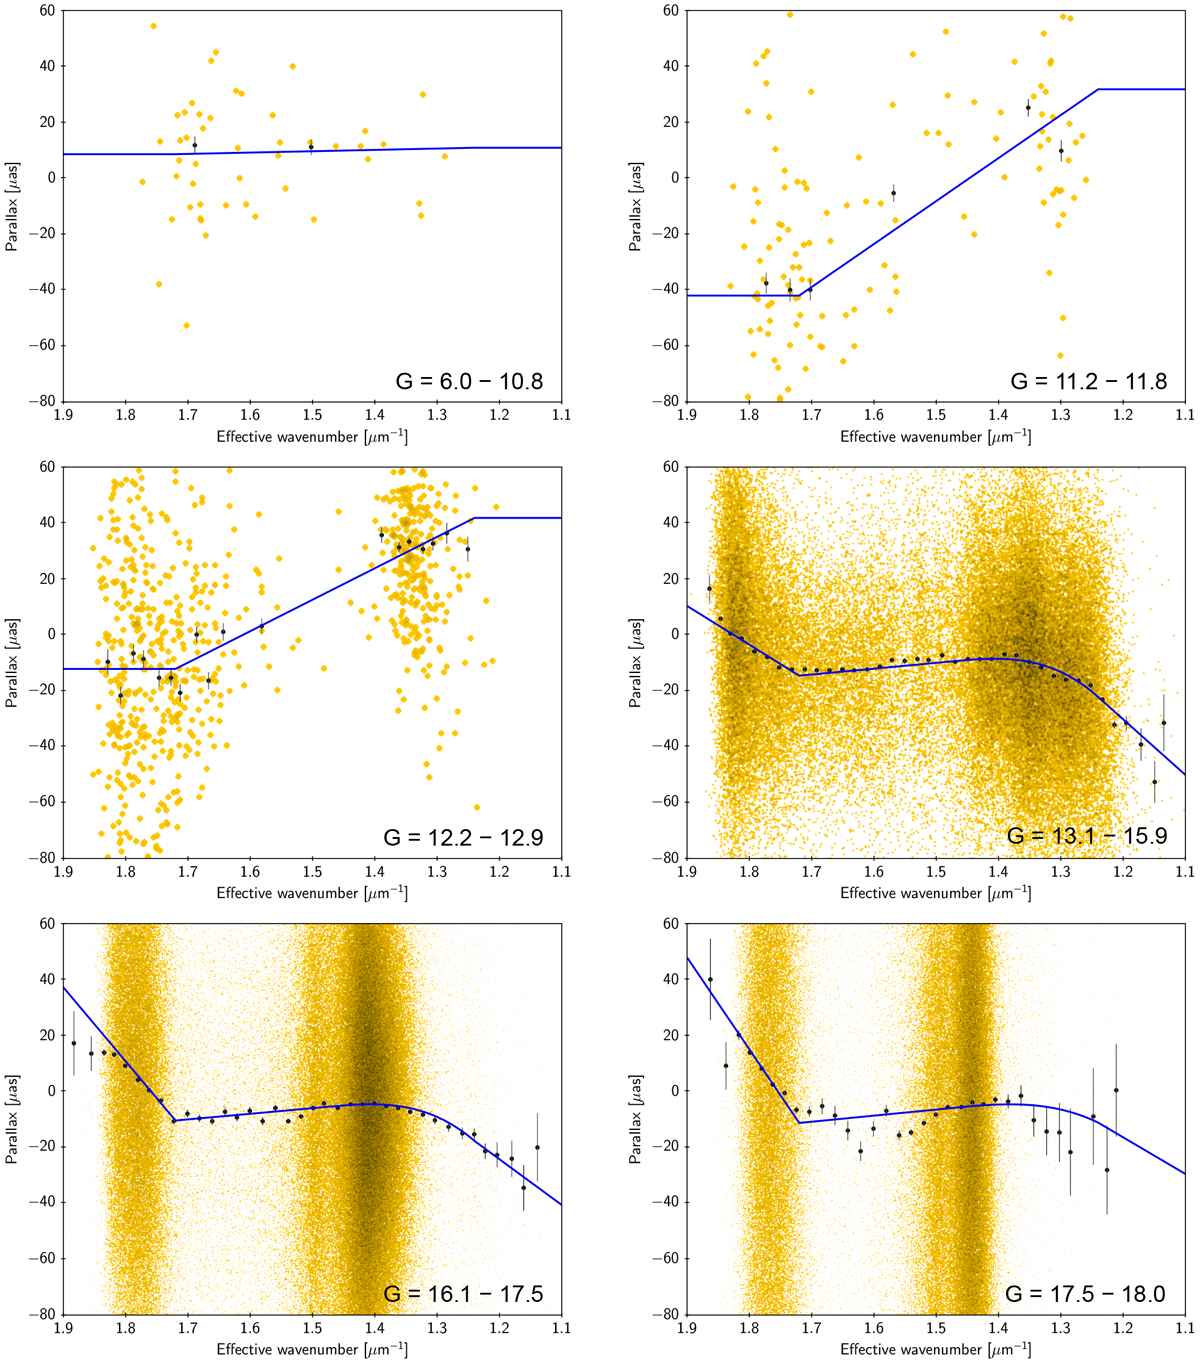
Median parallaxes for the LMC sample in Fig. 9 plotted against νeff in six magnitude intervals, as indicated in the diagrams. The orange points show the parallaxes of individual sources and give an impression of the coverage in νeff and scatter in parallax. The black dots, with error bars, show the median parallax and its uncertainty in bins of νeff with at least 20 sources per bin. The solid blue curves show the fitted combination of basis functions in Eq. (9) evaluated for a representative magnitude (G = 10.0, 11.5, 12.5, 15.0, 17.0, and 18.0) in each interval.
Current usage metrics show cumulative count of Article Views (full-text article views including HTML views, PDF and ePub downloads, according to the available data) and Abstracts Views on Vision4Press platform.
Data correspond to usage on the plateform after 2015. The current usage metrics is available 48-96 hours after online publication and is updated daily on week days.
Initial download of the metrics may take a while.