Free Access
Fig. 2.
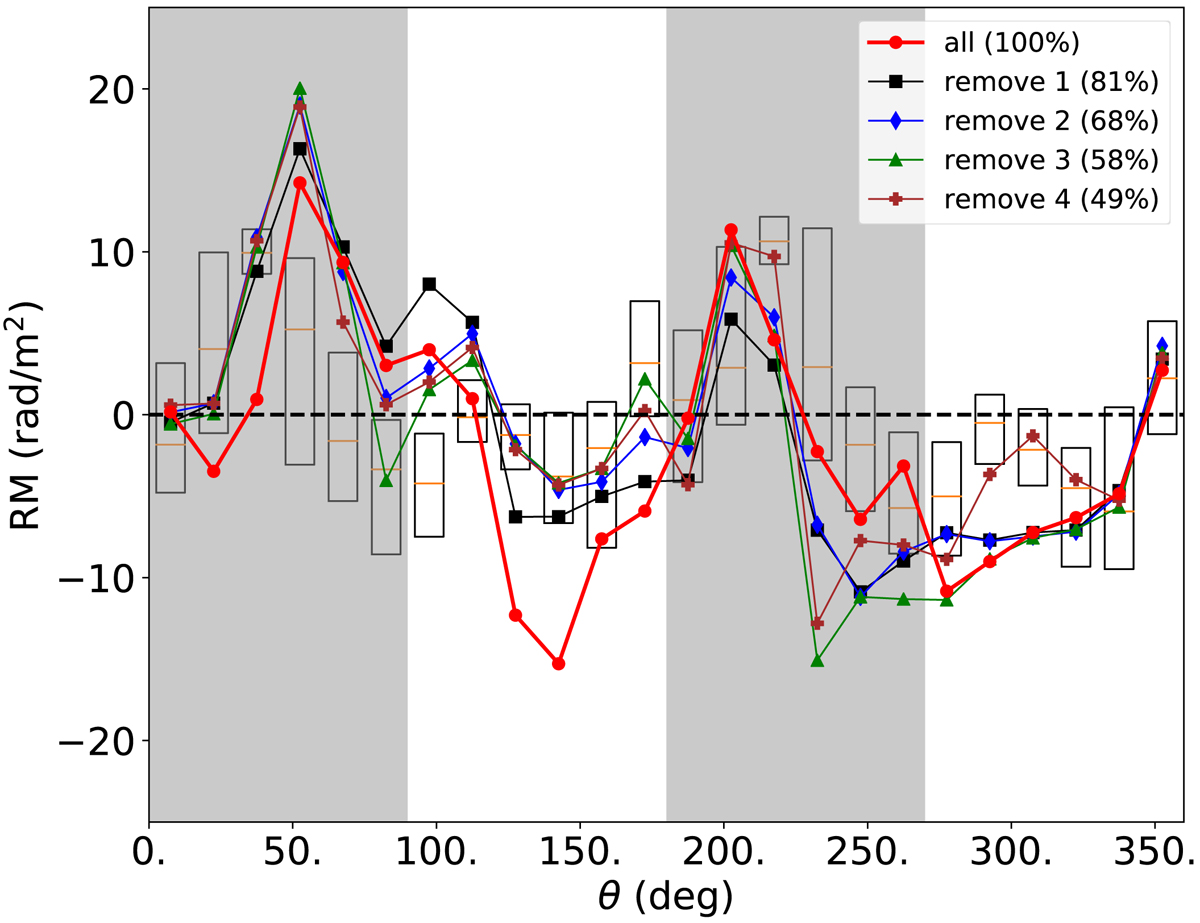
Superposed mean RM angular distributions after removing, one-by-one, the four galaxies with the most RM values inside the white ellipse of Fig. 1 (the remaining percentage of RM values shown in the legend). Details of box plot in the text. The universal pattern roughly persists.
Current usage metrics show cumulative count of Article Views (full-text article views including HTML views, PDF and ePub downloads, according to the available data) and Abstracts Views on Vision4Press platform.
Data correspond to usage on the plateform after 2015. The current usage metrics is available 48-96 hours after online publication and is updated daily on week days.
Initial download of the metrics may take a while.