Fig. 1.
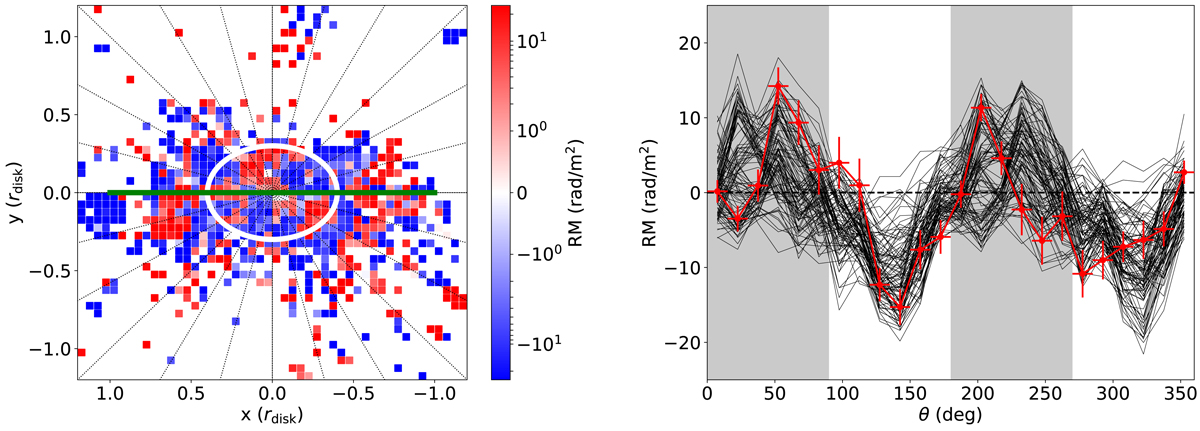
Left: mean RM map corresponding to the red line in the right panel. Color plot: binned RM values (logarithmic color scale from −25 to +25 rad m−2). Thick white line: elliptical region where most bins contain contributions from several galaxies. Thick green line: horizontal extent of edge-on rescaled 22 μm infrared disk. Thin dotted lines: 15° angular sectors around the center. Right: red line: mean RM distribution around the center of the mean CHANG-ES galaxy inside the white ellipse on the left (see text for details). Angles measured clockwise from the left horizontal semi-axis. The alternating gray and white colors of the background indicate the four quadrants of the mean RM map. 100 thin black lines: similar to red line after random rotation of half the sample of the aligned galaxies by 180°. The underlying universal pattern survives, on average, after these random 180° rotations.
Current usage metrics show cumulative count of Article Views (full-text article views including HTML views, PDF and ePub downloads, according to the available data) and Abstracts Views on Vision4Press platform.
Data correspond to usage on the plateform after 2015. The current usage metrics is available 48-96 hours after online publication and is updated daily on week days.
Initial download of the metrics may take a while.