Fig. B.5
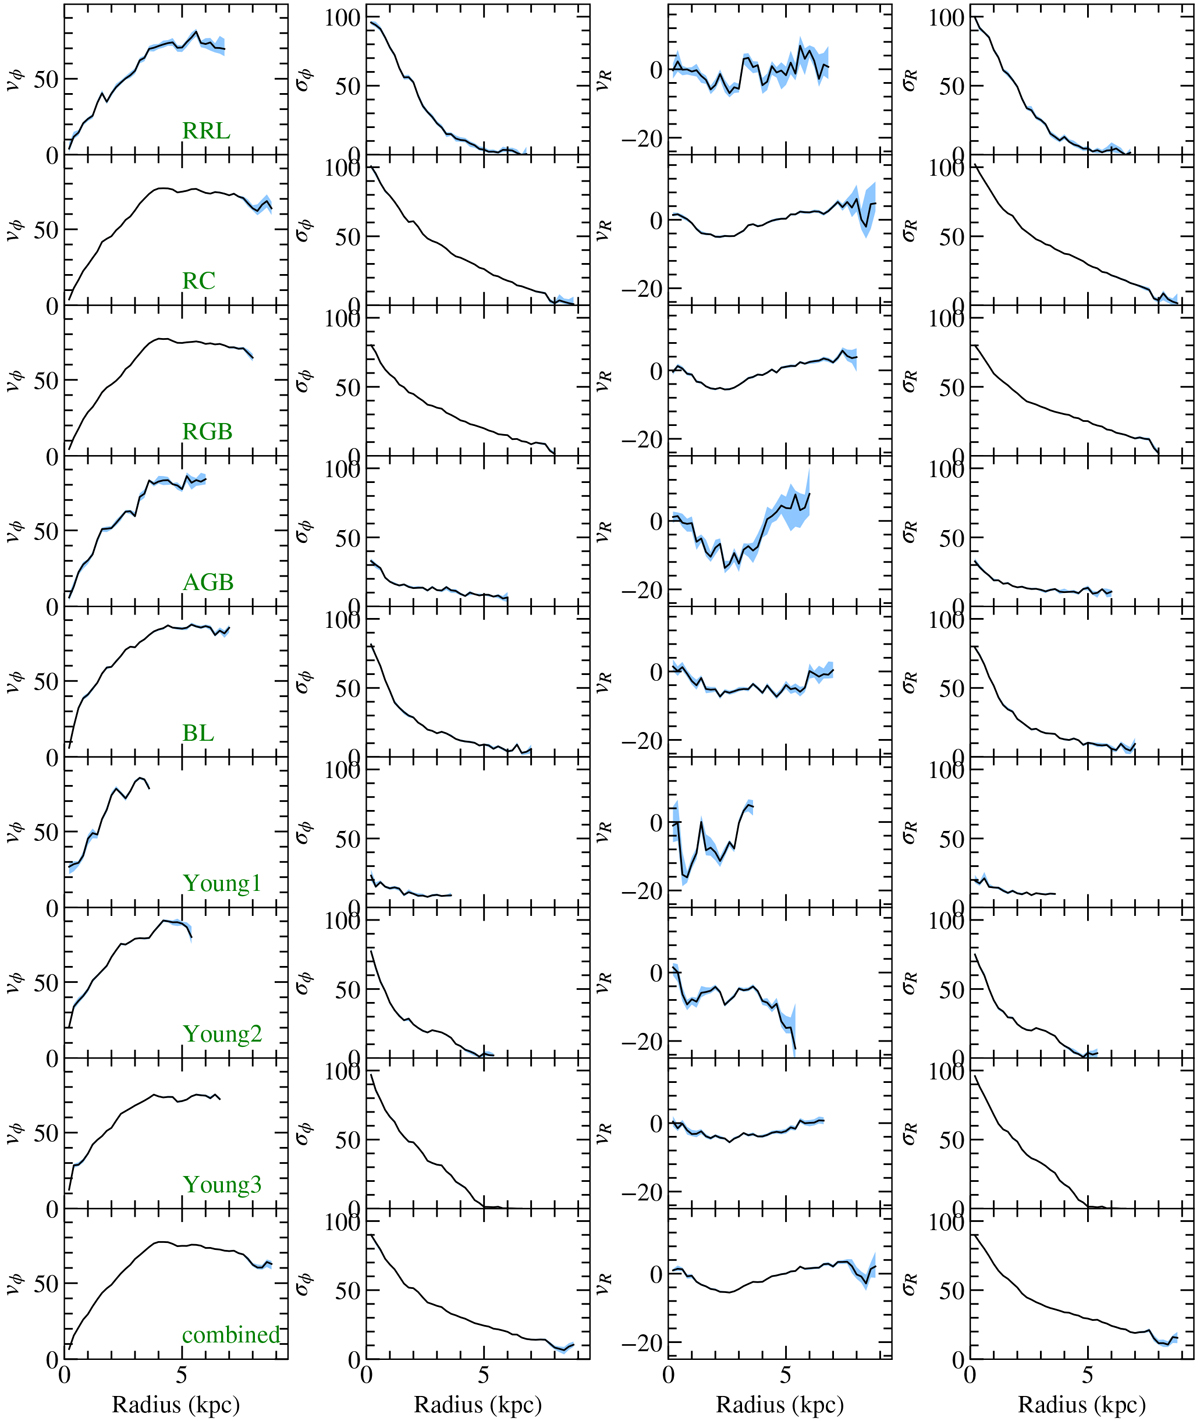
Velocity profiles of the LMC. Rotation curve (vϕ), tangential velocity dispersion (σϕ), radial velocity (vR), and radial velocity dispersion (σR) from leftto right for each stellar evolutionary phase (from top to bottom). Velocities are in km s−1. Bottom row: result for the combined sample. The blue shaded areas correspond to the uncertainties.
Current usage metrics show cumulative count of Article Views (full-text article views including HTML views, PDF and ePub downloads, according to the available data) and Abstracts Views on Vision4Press platform.
Data correspond to usage on the plateform after 2015. The current usage metrics is available 48-96 hours after online publication and is updated daily on week days.
Initial download of the metrics may take a while.