Free Access
Fig. B.1
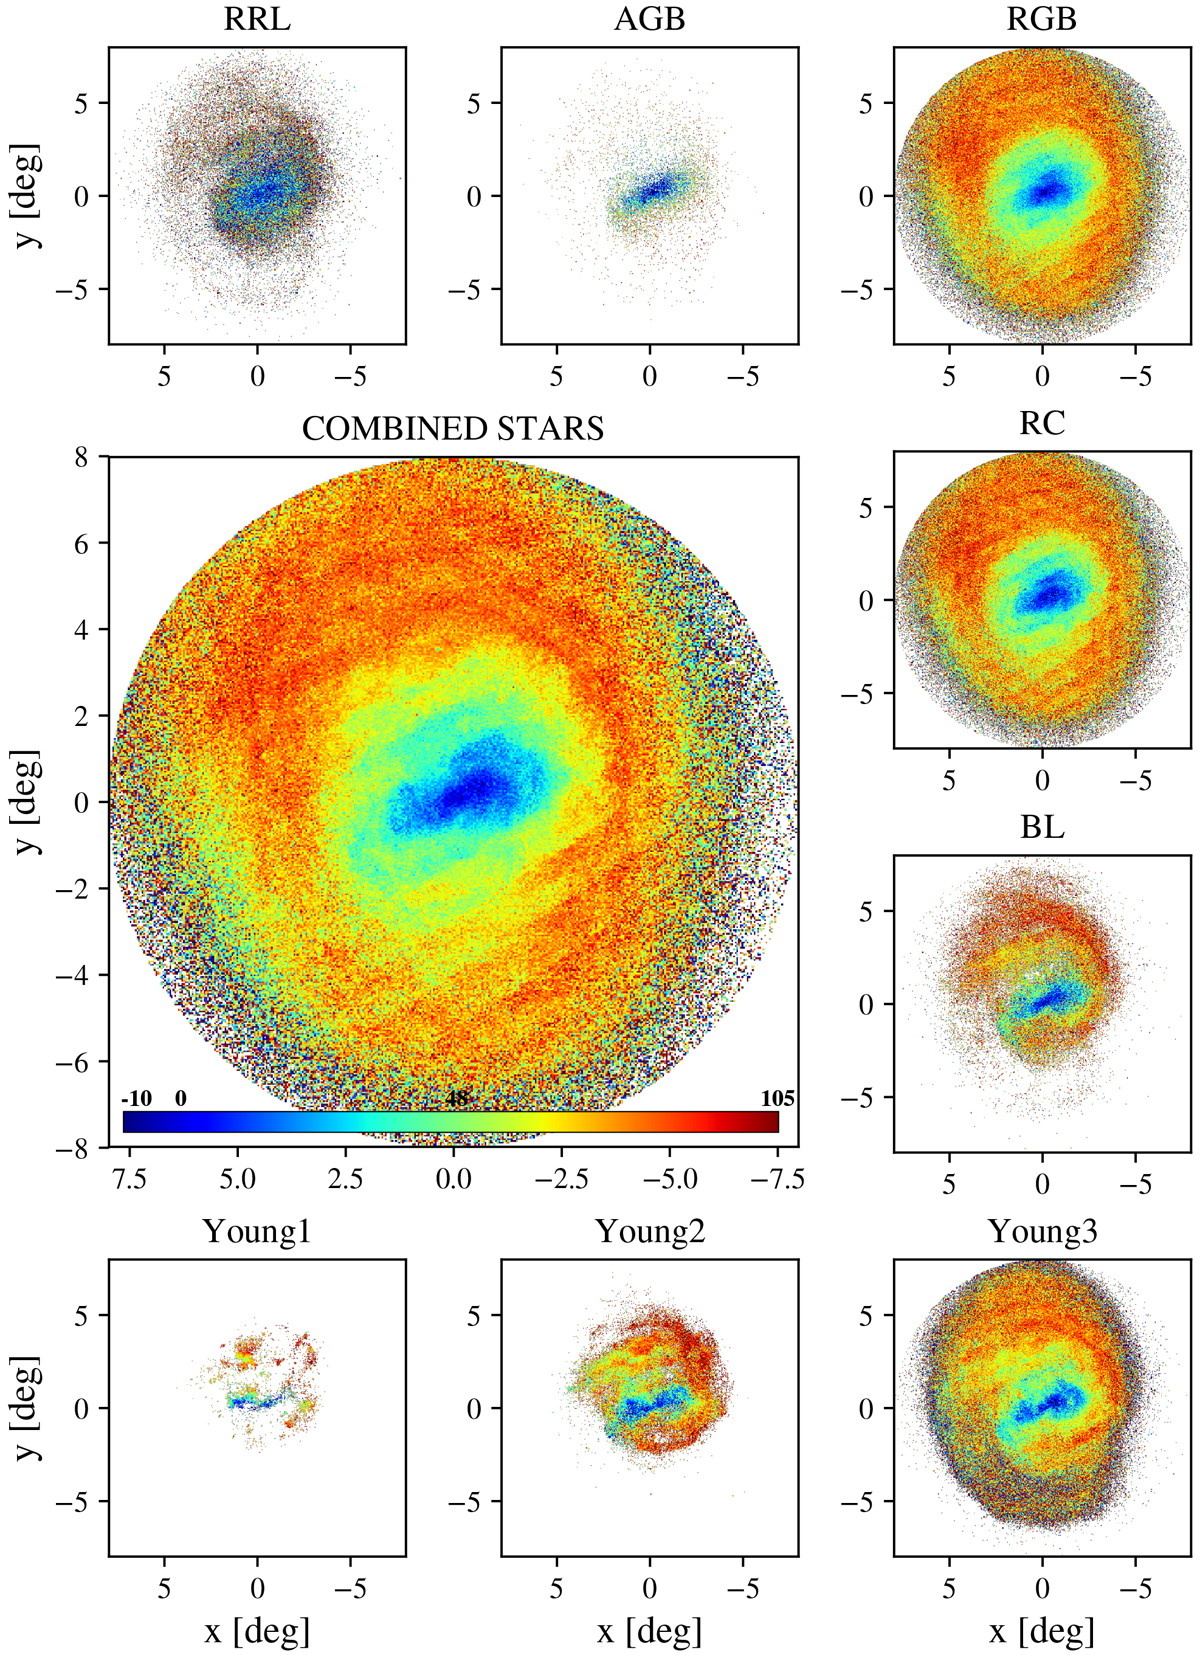
Azimuthal velocity maps vϕ of the LMC for the combined sample (main panel) and the various evolutionary phases. The linear velocity scale shown by the colour bar in the main panel is the same in all subpanels and has been chosen to highlight velocity patterns better.
Current usage metrics show cumulative count of Article Views (full-text article views including HTML views, PDF and ePub downloads, according to the available data) and Abstracts Views on Vision4Press platform.
Data correspond to usage on the plateform after 2015. The current usage metrics is available 48-96 hours after online publication and is updated daily on week days.
Initial download of the metrics may take a while.