Free Access
Fig. 21
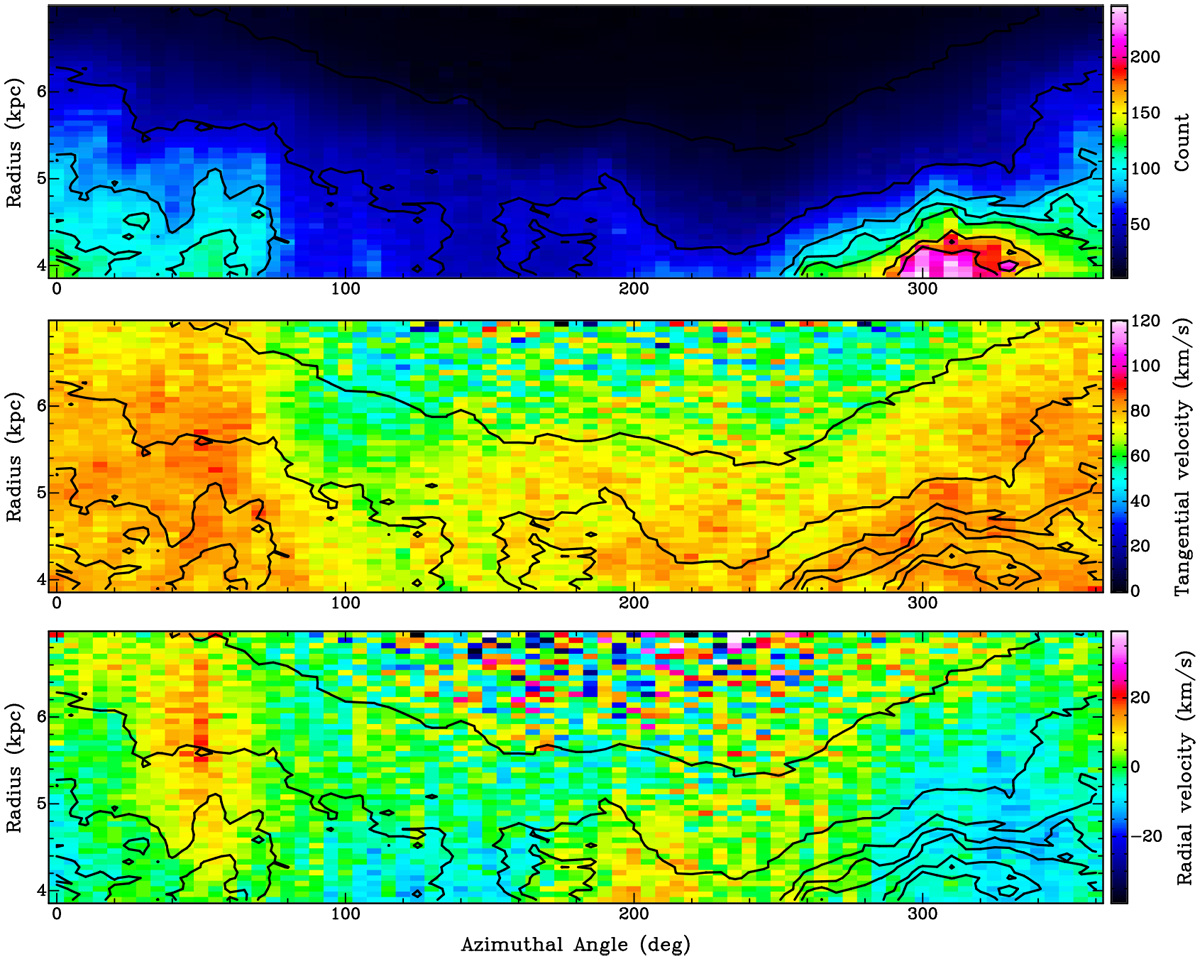
Streaming motions across and along the eastern spiral arm of the LMC. The azimuth-radius diagrams show the stellar density (top panel), the tangential velocity (middle panel), and radial velocity (bottom panel). Contours represent the stellar density shown in the upper panel.
Current usage metrics show cumulative count of Article Views (full-text article views including HTML views, PDF and ePub downloads, according to the available data) and Abstracts Views on Vision4Press platform.
Data correspond to usage on the plateform after 2015. The current usage metrics is available 48-96 hours after online publication and is updated daily on week days.
Initial download of the metrics may take a while.