Fig. 19
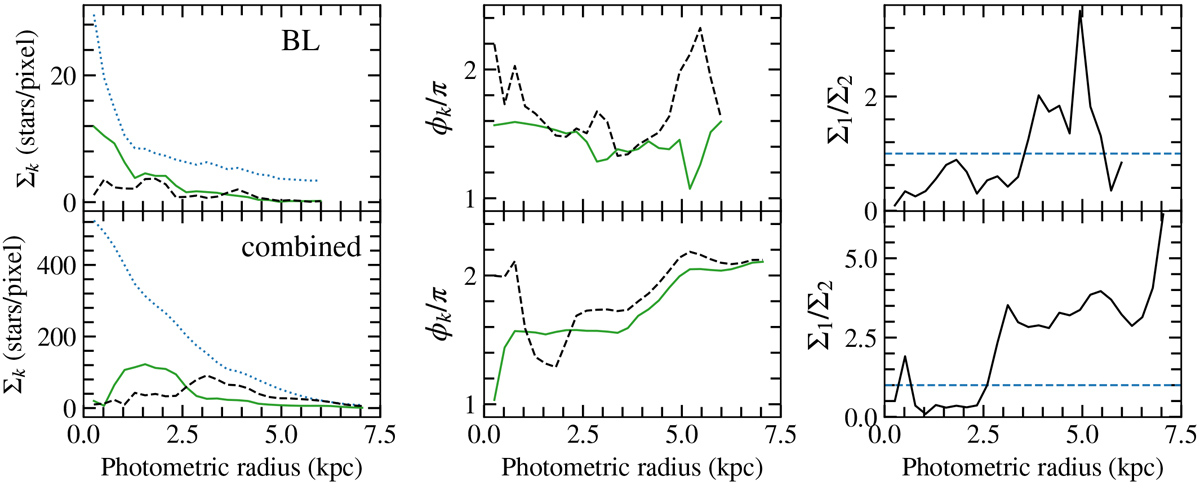
Results of the Fourier transform of stellar density maps of the LMC for the BL and the combined samples (upper and bottom panels, respectively). Left and middle panels: amplitude and phases of the first- and second-order asymmetries (dashed black and solid green lines, respectively). The axisymmetric density is shown as a dotted blue line. Right panel: k = 1 perturbation over the bisymmetry strength ratio. The galactocentric radius is given here in the photometric frame, with Ωphot = 10° as the reference photometric position angle.
Current usage metrics show cumulative count of Article Views (full-text article views including HTML views, PDF and ePub downloads, according to the available data) and Abstracts Views on Vision4Press platform.
Data correspond to usage on the plateform after 2015. The current usage metrics is available 48-96 hours after online publication and is updated daily on week days.
Initial download of the metrics may take a while.