Fig. 18
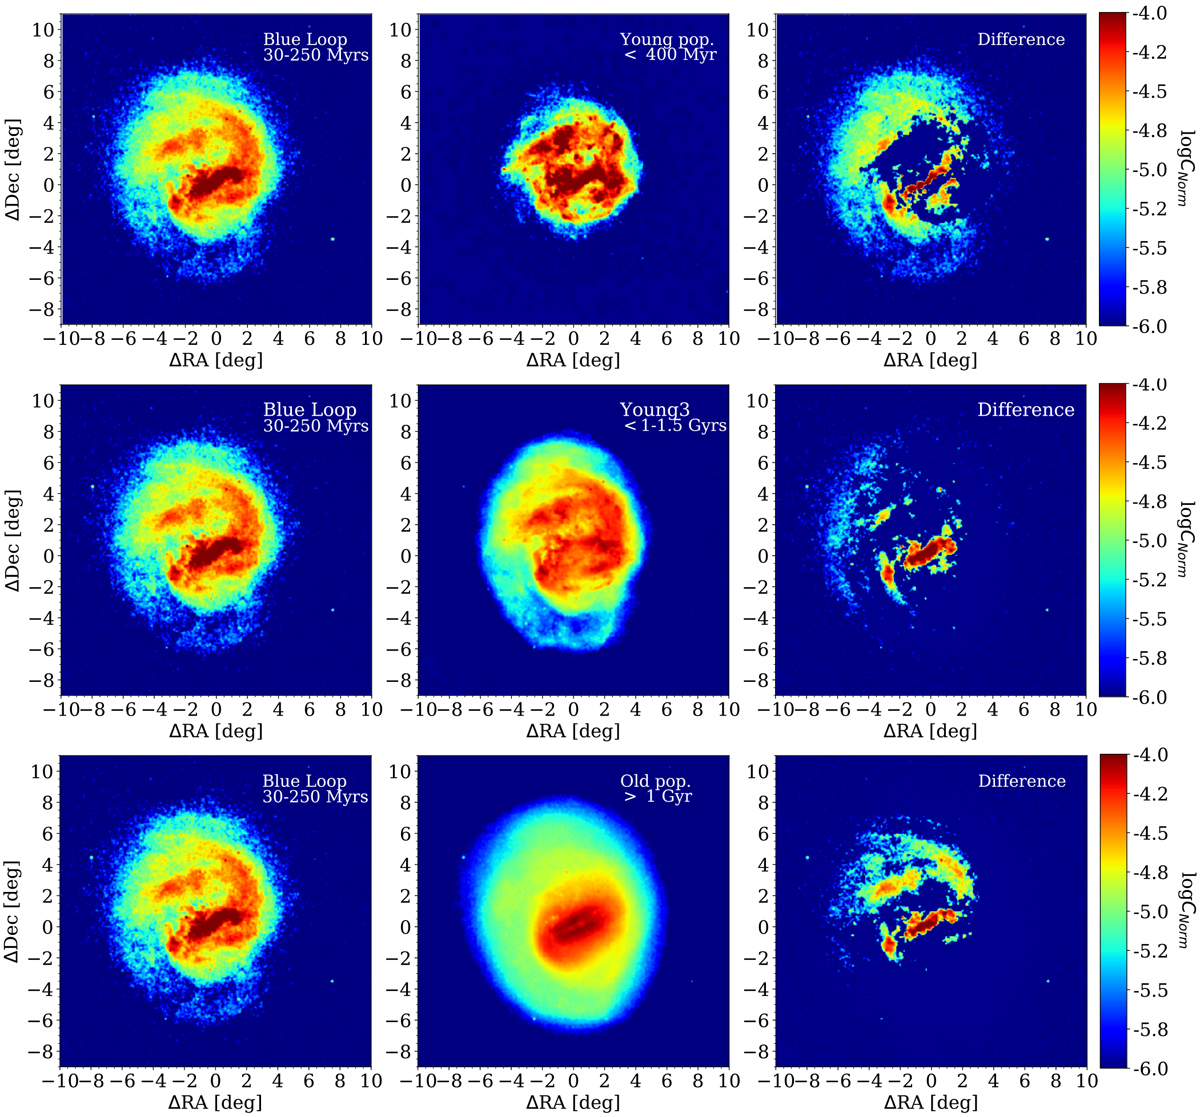
Differential density maps for different stellar populations in the LMC. Left column: density map in the BL evolutionary phase. Middle panels from top to bottom: density maps of the young phase, i.e. stars with age <400 Myr, Young 3 phase, i.e. main- sequence stars with age 1−1.5 Gyr, and oldphase, i.e. stars with age >1 Gyr. Right column: normalised difference between the left and middle panel maps, shown with a logarithmic stretch.
Current usage metrics show cumulative count of Article Views (full-text article views including HTML views, PDF and ePub downloads, according to the available data) and Abstracts Views on Vision4Press platform.
Data correspond to usage on the plateform after 2015. The current usage metrics is available 48-96 hours after online publication and is updated daily on week days.
Initial download of the metrics may take a while.