Fig. 14
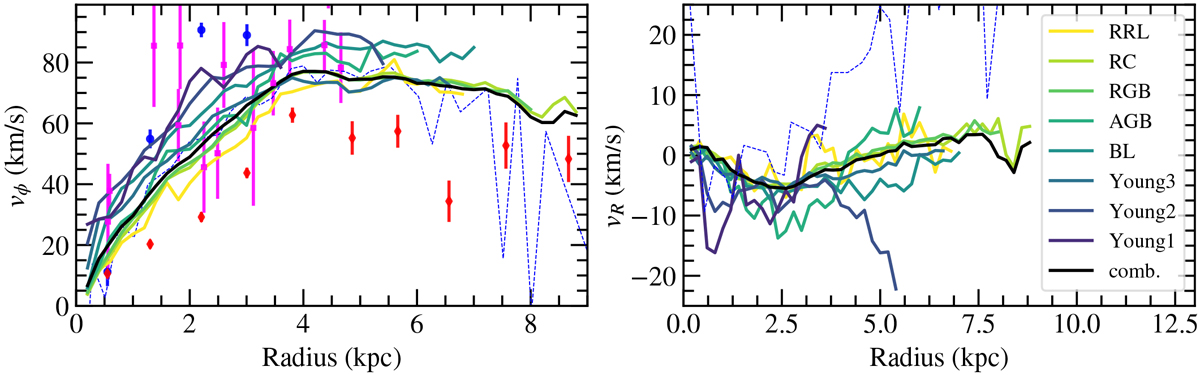
Stellar velocity curves of the LMC. Left and right panels: rotation curves and radial motions, respectively. Coloured lines are for the eight evolutionary phases and the combined sample, as given by the legend. In the left panel, blue circles, red diamonds and magenta squares are the rotation velocities for the samples of youngerand older stars from line-of-sight spectroscopic and HST astrometric measurements published in van der Marel & Kallivayalil (2014). The dashed blue lines are the tangential and radial velocity profiles derived by Wan et al. (2020) from Gaia DR2 astrometry.
Current usage metrics show cumulative count of Article Views (full-text article views including HTML views, PDF and ePub downloads, according to the available data) and Abstracts Views on Vision4Press platform.
Data correspond to usage on the plateform after 2015. The current usage metrics is available 48-96 hours after online publication and is updated daily on week days.
Initial download of the metrics may take a while.