Fig. 12
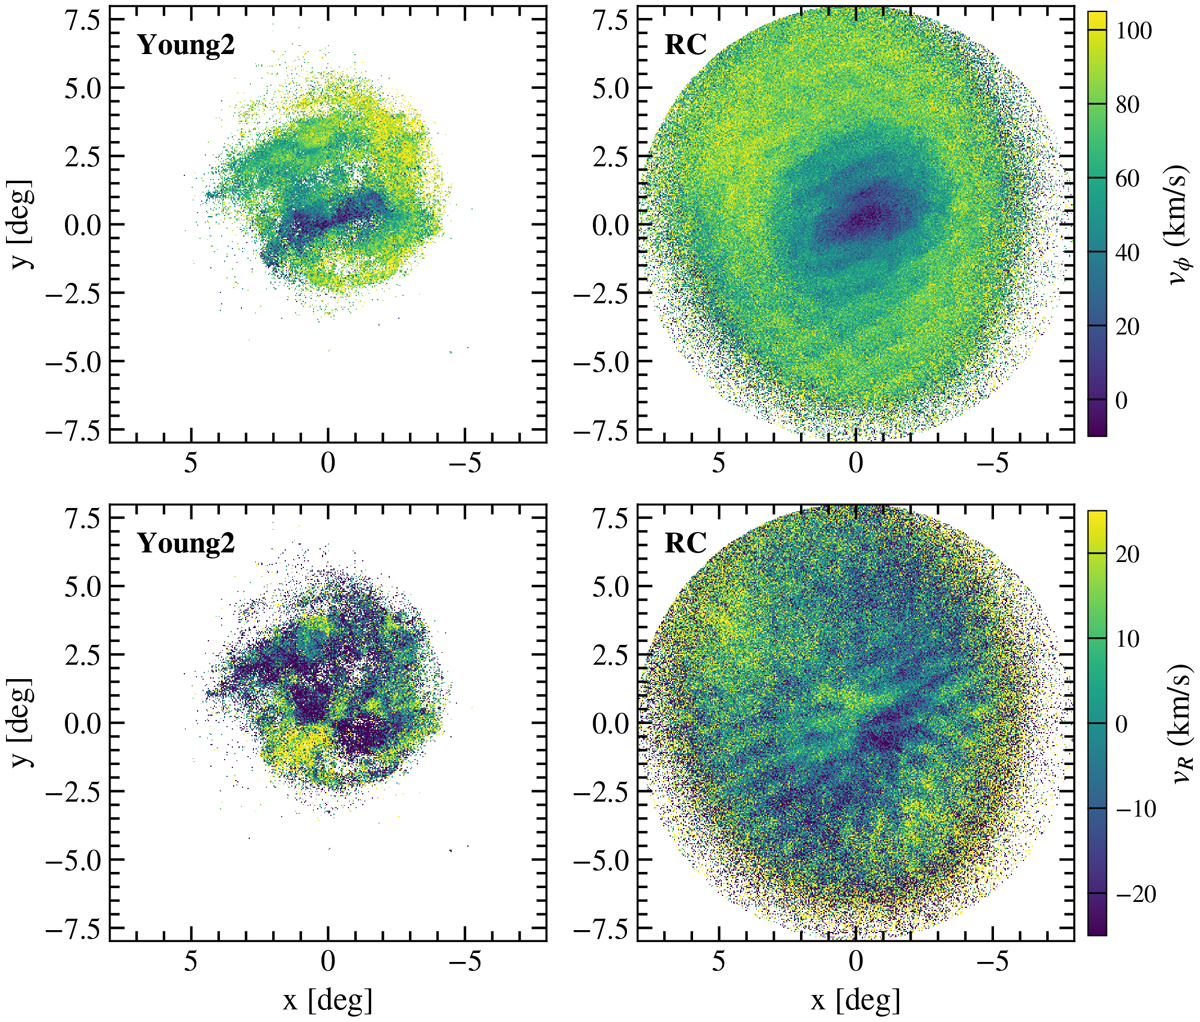
Example of velocity maps for the LMC. Left and right columns: young and evolved evolutionary phases (Young 2 and RC, respectively, see Sect. 2.3). Upper and bottom rows: vϕ and vR, respectively.The linear velocity scales shown by colour bars are the same for the two stellar evolutionary phases and were chosen to show the structure inside the velocity fields more clearly.
Current usage metrics show cumulative count of Article Views (full-text article views including HTML views, PDF and ePub downloads, according to the available data) and Abstracts Views on Vision4Press platform.
Data correspond to usage on the plateform after 2015. The current usage metrics is available 48-96 hours after online publication and is updated daily on week days.
Initial download of the metrics may take a while.