Fig. 10
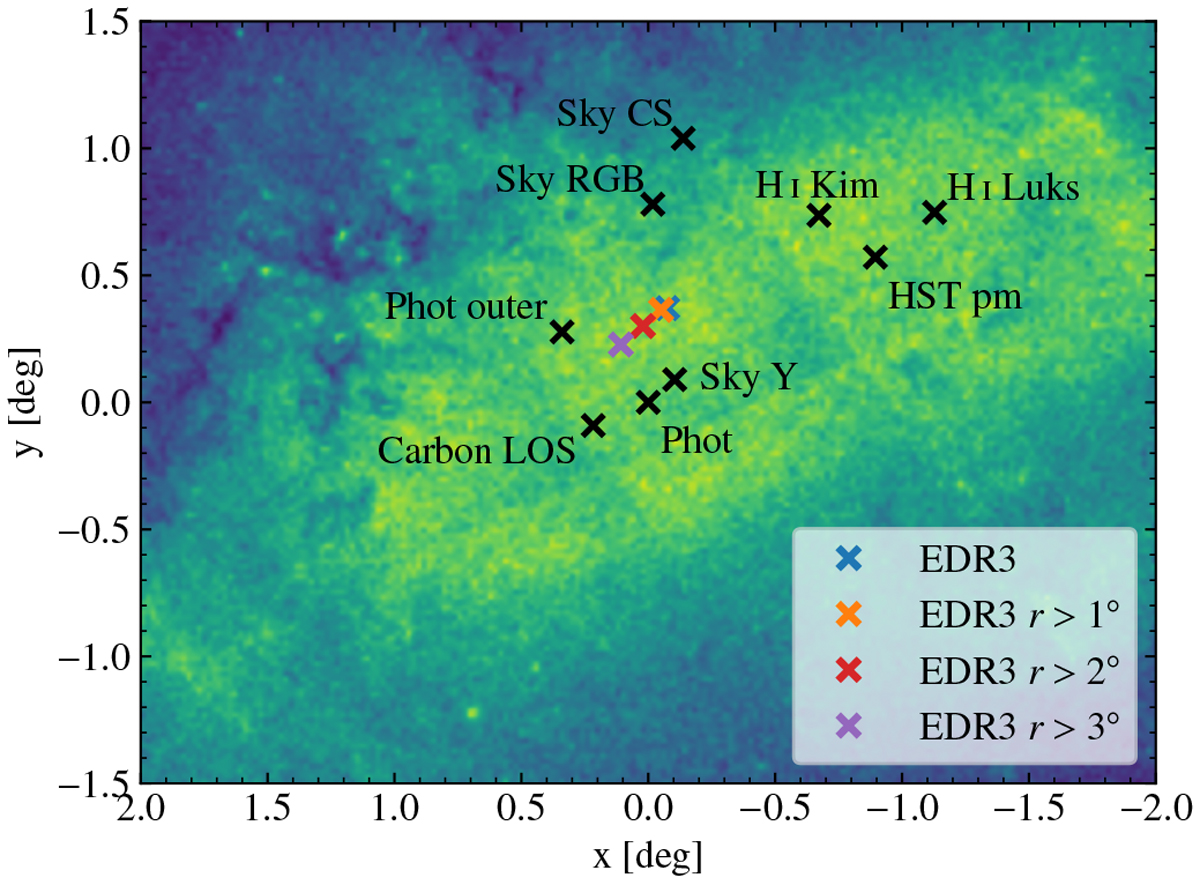
Positions of the centre of the LMC as found by different studies (as described in the text, SkyMapper estimates are referred to as “Sky” in the figure) superimposed on an image coloured according to the total density in star counts in the inner few degrees of the LMC. The centres found in this study lie closer to the photometric centre than to the centre of H I rotation.
Current usage metrics show cumulative count of Article Views (full-text article views including HTML views, PDF and ePub downloads, according to the available data) and Abstracts Views on Vision4Press platform.
Data correspond to usage on the plateform after 2015. The current usage metrics is available 48-96 hours after online publication and is updated daily on week days.
Initial download of the metrics may take a while.