Free Access
Fig. 1
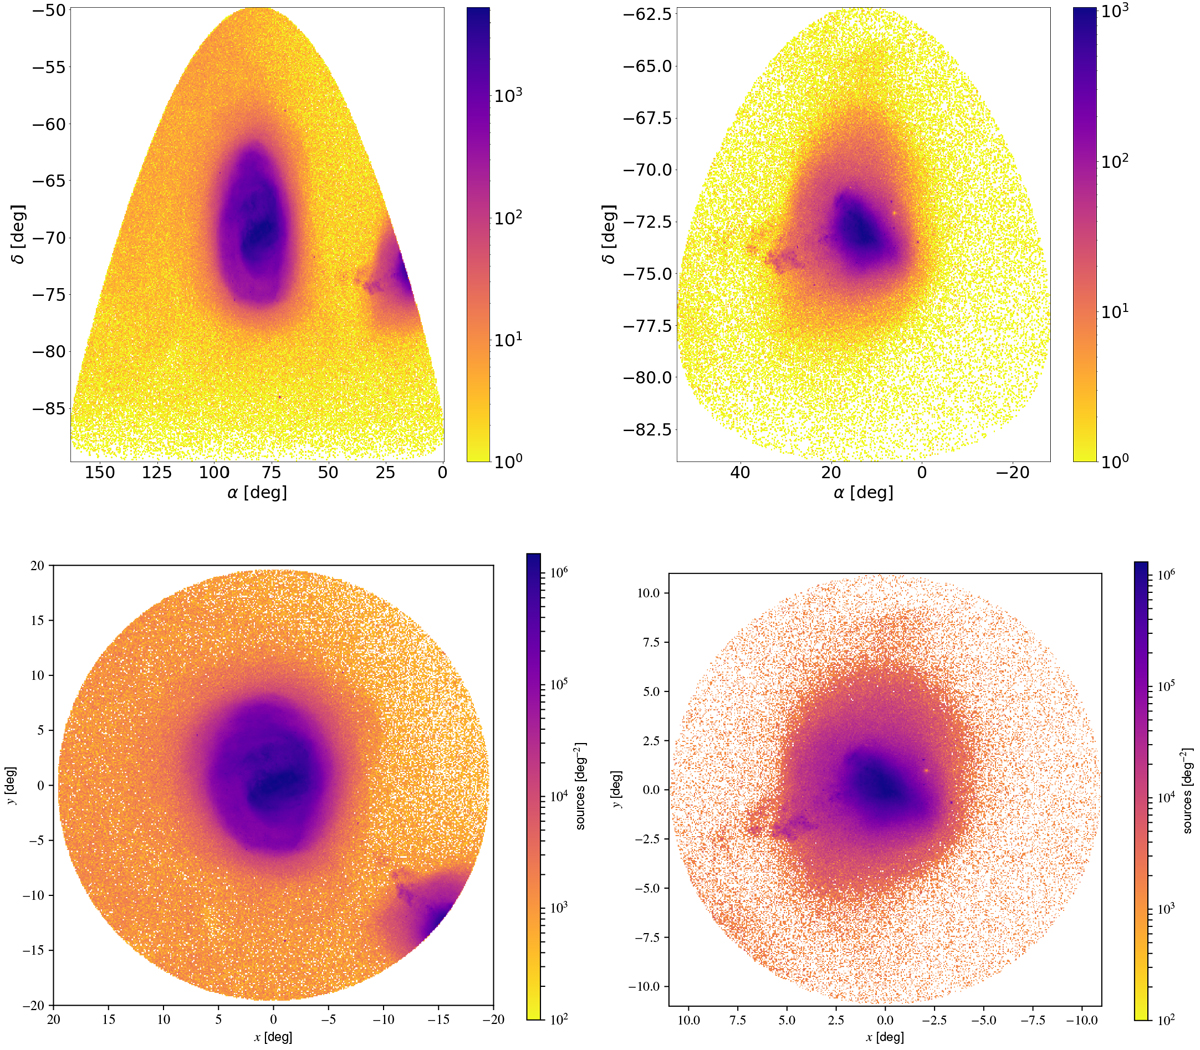
Sky density plots for the LMC (left) and SMC (right) clean samples (after spatial and proper motion selection). Top row: plots in equatorial coordinates. Bottom row: orthographic projection (as used in Sect. 3)
Current usage metrics show cumulative count of Article Views (full-text article views including HTML views, PDF and ePub downloads, according to the available data) and Abstracts Views on Vision4Press platform.
Data correspond to usage on the plateform after 2015. The current usage metrics is available 48-96 hours after online publication and is updated daily on week days.
Initial download of the metrics may take a while.