Fig. 7
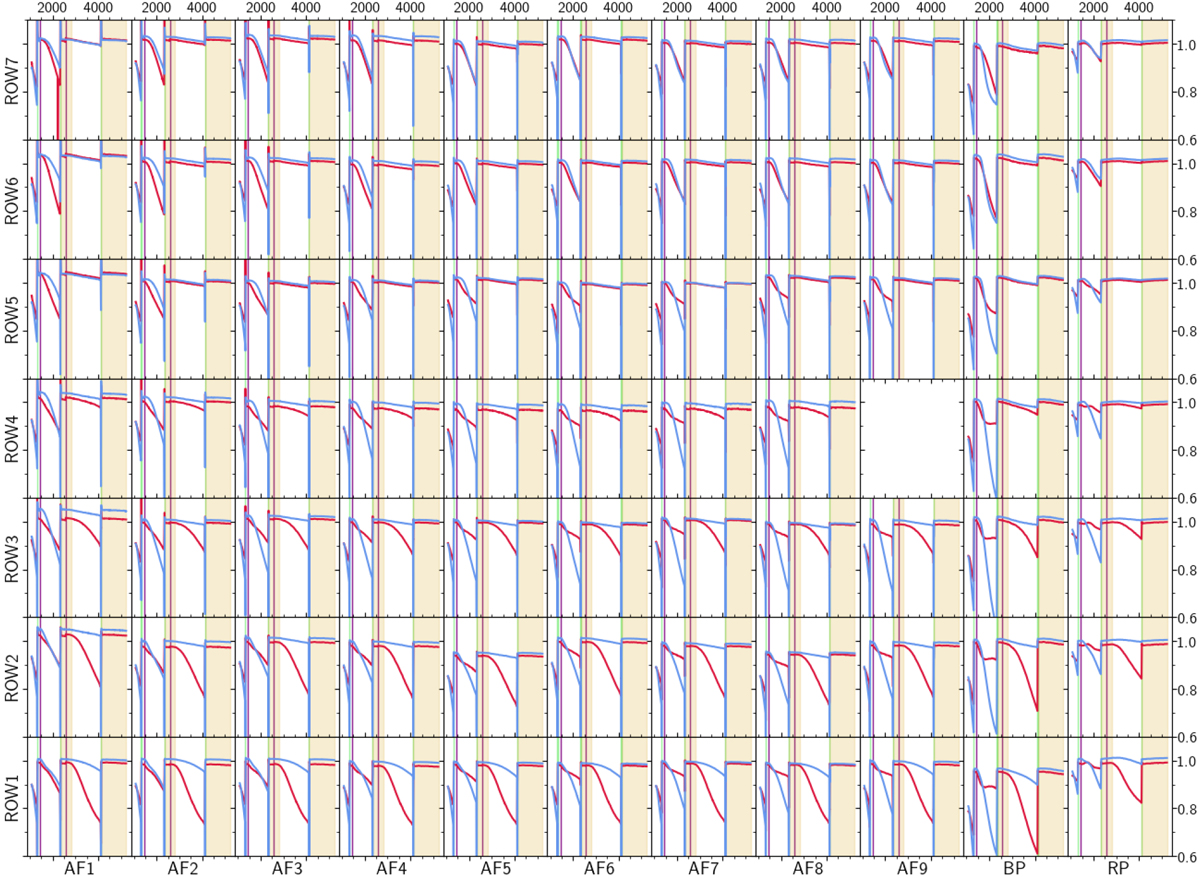
Time dependence of the calibration factor for the whole focal plane showing the AF, BP, and RP CCDs for each row. This plot covers the Window Class 1 and 2, ungated configurations. The blue line shows the preceding FoV and the red line shows the following FoV. The shaded area shows the INIT period. The vertical green lines show the decontamination events and the purple vertical lines the refocussing events.
Current usage metrics show cumulative count of Article Views (full-text article views including HTML views, PDF and ePub downloads, according to the available data) and Abstracts Views on Vision4Press platform.
Data correspond to usage on the plateform after 2015. The current usage metrics is available 48-96 hours after online publication and is updated daily on week days.
Initial download of the metrics may take a while.